Home » New Gear Alerts » New Audio Gear Alert: KH 150 Monitors by Neumann, Tracktion Updates Waveform Free & INFILTRATOR 2 by Devious Machines Neumann unveils the DSP-powered KH 150 studio monitor. Neumann unleashes a powerful DSP-powered monitor solution. Neumann.Berlin expands their line of reference-class studio monitors with the KH 150. The bi-amplified, DSP-controlled loudspeaker features the same high-resolution tweeter as all Neumann studio monitors and a newly developed 6.5” woofer with ultra-low distortion and high SPL capability. Despite its rather compact format, the KH 150 surprises with outstanding clarity, even at high volume, and extended low-end. The KH 150 has an exceptionally flat frequency response from 39 Hz to 21 kHz (±3 dB) and is recommended for all applications from broadcast to music production—including styles that require a powerful, deep low-end and/or elevated listening levels such as urban music, EDM, and film scoring. For pricing and further information, click here.
Tracktion releases 2022 update for Waveform Free. Tracktion implements crucial updates into their free version of Waveform. Waveform Free, the world’s only cross platform, unrestricted and fully featured free DAW is based on the essential features of Waveform Pro 12, renowned for its efficient workflow, streamlined user interface and its intuitive usability. There are no restrictions whatsoever in Waveform FREE: No timeouts, watermarks track count limits, export / render restrictions, 3rd party plugin restrictions, saving or project limitations and copyright restrictions. Waveform FREE is a highly creative, deep and flexible DAW ideal for podcasting, producing, recording or mixing music. The new 2022 Waveform FREE has an entirely new browser offering tags, favorites and smart lists, with the same look and feel of Pro 12. It now has 15 Refreshed Audio Effects and 6 Super handy utility plugins, including a much requested convert to Mono tool and Spectrum analyzer. The dedicated Actions Panel allows you to favorite your most used actions and create custom actions which can be recalled with the click of a button. For further information on the 2022 Waveform Free update, click here.
Devious Machines launches INFILTRATOR 2 Devious Machines furthers their popular INFILTRATOR with version 2. Devious Machines are back with INFILTRATOR 2, the turbocharged sequel to their acclaimed multi-effect powerhouse. INFILTRATOR 2 features twice the effects, twice the presets, and twice the modulation power—all with the same intuitive workflow. Combine up to 10 effects from the 54 world-class modules. Modulate key parameters using powerful multi-segment envelopes. Control the entire ensemble using the onboard sequencer and assignable macros. Build your own effect chains, or draw from the vast library of over 1500 mind-blowing presets. Whether it’s conventional effects or reality-bending sonic madness, Infiltrator puts it all at your fingertips. For pricing and further information, click here.
Please note: When you buy products through links on this page, we may earn an affiliate commission. | SWEETWATER | THOMANN | AMAZON | REVERB |
August 25 Scooter Doll – Aug. 25th 2022 9:18 am PT
@SCOOTERDOLL Mercedes-Benz announced the official launch of EQS SUV production today, the first of its EQ line to be built entirely in the US. With a start of production and Mercedes’ Tuscaloosa assembly plant in Alabama, we expect to hear EQS SUV pricing soon as deliveries remain on track for later this year. With the recent signing of the Inflation Reduction Act, we wonder if the US-built electric SUV will qualify for federal tax credits under the new terms of the bill.
The public first caught wind of an SUV version of Mercedes-Benz’s EQS sedan in October of 2020 when the German automaker shared cameoed footage of its first three EVs on its new electrified EQ line: the EQS, the EQE sedans, and the EQS SUV. The EQS sedan has already reached consumers and received wide acclaim, and the smaller EQE will soon follow. But it’s the SUV version of the former that has a lot of people excited. Mercedes shared a slew of new details and performance specs of the EQS SUV this past April. Check all those out here. Today, the EQS SUV moves closer to deliveries as its assembly lines at Mercedes’s carbon-neutral facility begin to hum with the welcomed sounds of EV production. The German automaker announced its official start of EQS SUV production in the US in a press release today, sharing details of the CO2-neutral production facilities in Bibb County, Alabama, which includes a passenger vehicle plant in Tuscaloosa and a new battery plant where the EQS battery systems are built. The Tuscaloosa site has been in operation by Mercedes since 1997 and, with its start of EQS SUV production, marks its pivot toward EV assembly on American soil. Jörg Burzer, member of the board of management of Mercedes-Benz Group AG, production and supply chain, spoke: Our production network is very well positioned for the sustainable and rapid scaling of electric vehicle volumes. With the new EQS SUV joining our production portfolio of all-electric Mercedes-EQ models, we reached another important milestone in our strategy to go all electric by the end of the decade – wherever market conditions allow. I am absolutely sure that our great Tuscaloosa team will make the electric SUV another global success. The EQS SUV production in Alabama will soon be followed by the assembly of the recently announced EQE SUV later this year. Both all-electric EVs and their battery components being assembled in the US will prove vital for any chance at qualifying for federal tax credits under stricter terms defined under the recently signed Inflation Reduction Act. Mercedes will already clear two crucial requirements by building its electric SUVs and batteries on US soil, but they will also need to come in below the $80,000 MSRP threshold for electric SUVs. For comparison, the sedan version of the Mercedes EQS starts at an MSRP of $102,310 for the “lower end” 450+ trim. Since the German automaker has yet to share any pricing, we are left to wonder if these vehicles will qualify for money back while the dust of confusion and fine print settles on the capital. We are certain to learn more when Mercedes eventually shares EQS and EQE SUV pricing, which should be fairly soon considering their scheduled delivery timelines. More details to come. Add Electrek to your Google News feed. FTC: We use income earning auto affiliate links.More. Subscribe to Electrek on YouTube for exclusive videos and subscribe to the podcast.
@SCOOTERDOLL Scooter Doll is a writer, designer and tech enthusiast born in Chicago and based on the West Coast. When he’s not offering the latest tech how tos or insights, he’s probably watching Chicago sports. Please send any tips or suggestions, or dog photos to him at [email protected] California 2035 gas car ban is final – why it's huge Tesla launches cheaper Model Y in Europe Direct-to-satellite Starlink coming to Tesla cars Will Mercedes EQS SUV get the US tax credit?
WHNT.com Please enter a search term. Please enter a search term. by: Zach Hester Posted: Updated: by: Zach Hester Posted: Updated: HUNTSVILLE, Ala. (WHNT) — Huntsville was recently named the No. 1 city to live in in America by U.S. News and World Report. On Thursday night, the city celebrated that title. The celebration was held on Huntsville’s North Side Square. The event featured live music, an LED light experience, outdoor games, food, local artisans, and more! Ryals, the president of the Huntsville and Visitors Bureau says when people visit Huntsville it’s easy to see why it was voted the best city to live in. “I think there is a lot of curiosity about how we became that city,” Ryals stated. “With so many changes and additions, with our hotels, restaurants, our music industry, there’s just so much to be proud of right here in our city.” Mayor Tommy Battle and other city officials were also in attendance to help celebrate the occasion.
Copyright 2022 Nexstar Media Inc. All rights reserved. This material may not be published, broadcast, rewritten, or redistributed. Thanks for signing up! Watch for us in your inbox. Subscribe Now Thanks for signing up! Watch for us in your inbox. Subscribe Now
Advertisement Supported by wordplay, the crossword column You can count on Robert Logan’s Friday puzzle. Send any friend a story As a subscriber, you have 10 gift articles to give each month. Anyone can read what you share. By Rachel Fabi FRIDAY PUZZLE — What’s this? A theme on a Friday? This must be The Times’s karmic balance to this past Sunday’s themeless tour de force by Brooke Husic and Will Nediger. And as themes go, this one, in a debut by Robert Logan, is so subtle that you could be forgiven for not noticing it at all. I didn’t notice the theme at first, although I did observe that the grid had a rather strange layout for a themeless puzzle. I needed Mr. Logan’s revealer, at the final Across entry, to understand the purpose behind the unusual grid design. The revealer clue is “A 50/50 chance … or a description of the lengths of this puzzle’s Across and Down answers, respectively.” The answer here is EVEN ODDS, and a closer look at the grid reveals that all of the Across entries have an EVEN number of squares, while the Down entries have an odd number. Clever! 23A. Although “Retirement spots” sounds as if it’s asking for the sort of places retirees might move to ride out their golden years in peace, the meaning of retirement here is a tad more short term — people might retire to DENS after dinner to have a quiet evening. 24A./31D. I enjoyed the echo of the tone between the clues “Absolutely!” for YES INDEEDY and “Yep, that’s fine” for OKEY-DOKEY. 34A. “Explosive feedback?” isn’t earth-shattering commentary on a paper or a performance. The answer is RECOIL, the feedback one might feel after an explosion. 38A. The clue “A heavy one may want a lighter” plays on multiple meanings of the antonyms “heavy” and “light.” You might think this clue has something to do with weight, but instead it observes that a heavy SMOKER may want a lighter. 43A. The “Bottle of rum go-with” isn’t lime or mint (sorry, mojito lovers!). This clue alludes to the classic pirate ditty “Dead Man’s Chest,” also known as “YO, HO, HO (And a Bottle of Rum).” 55A. We’ve got another lovely misdirect with the clue “Food you might eat in a bed.” I immediately started thinking of the least crumb-producing foods one might consider eating while under the covers. However, RICE, though not particularly crumby, is the answer because of the way it is frequently served (as in, “salmon on a bed of RICE”). 5D. I had never heard of ADP, the “Big inits. in payroll services,” but apparently ADP is a company in the human resources sector. I am more familiar with the high school biology meaning of ADP — adenosine diphosphate — which plays a crucial role in cellular energy transfer. 8D. Speaking of high school biology, “They make up families” is the clue for GENUSES, which are one step down on the taxonomic ladder of kingdom, phylum, class, order, family, genus, species. 10D. “Joey who doesn’t wear pants” is ROO, the young kangaroo from “Winnie the Pooh.” 26D. “Free movie starring yourself?” is such a fun way of thinking about a DREAM. Even though my dreams are usually awfully mundane, I’m going to try to start thinking of them as movies starring myself. Maybe I’ll enjoy them a little more if I consider them free entertainment! 52D. Finally, “Board, so to speak” is the clue for MEALS, as in half of “room and board.” And now, a word from our constructor about his experience creating this puzzle: This one started one day when I randomly ran across someone else’s grid design and happened to notice all the four-letter slots were Downs and all the five-letter slots were Acrosses. Of course, my little nerd brain kicked in immediately: I wonder if a grid like that has been done before? I wonder if it can be? I thought I might be on to something when — surprisingly — the answers came back: Not that I can find and Yup. Although this grid design represents a nice technical feat, developing a theme is my constructor kryptonite, and I figured out pretty quickly that I’d had more substance in hospital broth than could be found in this theme. And that was the end of it. I put it away. But then the fill. It started to call out to me. Unbidden. At all hours. I realized I had never actually tried to fill that beautiful grid. It’s only 70 words. No theme required. Maybe if I just saw how clean I could get it … When all that positivity popped up and my mind started to wander to retirement spots on alluring tropical islands with rum, pirates, sheepdogs and sappy 1960s television, I knew my soul was home. I hope you found a little comfort as well. Cheers! The New York Times Crossword has an open submission system, and you can submit your puzzles online.
Mercedes-Benz on Thursday announced local pricing for its all-electric EQ model range. Closely related to the fuel-sipping Mercedes-Benz GLA, the new EQA 250 is a sporty compact SUV fitted with a 66.5kWh “double-decker” lithium-ion battery pack that acts as a structural element within the underbody of the vehicle. This is used to power a single asynchronous electric motor mounted on the front axle that delivers 140kW and 375Nm of torque — good enough for a 0-100km/h time of 8.6 seconds and top speed of 160km/h. In terms of range, Mercedes-Benz says the EQA 250 will travel a maximum of 429km on a charge. Charging the battery from 10 to 100% will take about six hours when plugged into an AC public charging station or an 11kW Wallbox. Plug into a DC rapid charging station and the battery will go from 10 to 80% in just 30 minutes. The EQA 250 will be available in SA from October with a price tag of R1,169,500. This includes a five-year/100,000km maintenance plan and an eight-year battery warranty. Following on from the EQB 250 is the EQB 350 4Matic: a lifestyle-orientated SUV that ups the ante with more power and an extra spacious cabin that offers seating for up to seven people. A 66kWh battery pack drives asynchronous electric motors fitted to the front and rear axles, culminating in superior traction across a broader spread of surfaces. With a total system output of 215kW and 520Nm of torque, the EQB 350 4Matic will sprint from rest to 100km/h in 6.2 seconds and onward to a top speed of 160km/h. Maximum driving range comes in a 423km with charging times similar to that of the EQA 250. Pricing for the EQB 350 4Matic starts at R1,374,500. This includes a five-year/100,000km maintenance plan and an eight-year battery warranty for peace of mind motoring. Next up in the range is the sleek EQC 400 4Matic: a crossover luxury SUV that makes a strong visual statement courtesy of its low waistline and coupé-like rear roof recess. As with the EQB 350, the EQC 400 4Matic benefits from an asynchronous electric motor on each axle. They are juiced by a larger 80kWh battery pack and put out a combined system output of 300kW and 760Nm of torque. As to be expected, this provides impressive acceleration with Mercedes-Benz claiming a 0-100km/h dash of just 5.1 seconds. However, as with its lesser siblings, top speed is capped at a slightly more sensible 160km/h. When plugged into a 110kW high-speed DC charging unit, the battery of the EQC 400 4Matic can be charged from 10 to 80% capacity in about 40 minutes. With a full charge, Mercedes-Benz claims this SUV can achieve a maximum range of 437km. Pricing? You’re looking at R1,679,000 sans any options. Like the other EQ models, a five-year/100,000km maintenance plan and an eight-year battery warranty is standard. Finally, there’s the flagship EQS sedan that, much like its petrol-powered S-class cousin, provides an impressive blend of luxury, performance and innovation. Two models are available in SA, starting with the EQS 450+ that comes fitted with a large 107.8kWh lithium-ion battery pack. This powers a permanently excited synchronous motor fitted to the rear axle. Peak power is 245kW while torque measures in at a healthy 568Nm. In terms of performance, you can expect 0-100km/h in 6.2 seconds and a top speed of 210km/h. Mercedes-Benz claims a maximum driving range of up to 782km on a charge. For those seeking a bit more electric muscle, the AMG EQS 53 4Matic+ ships with an extra permanently excited synchronous motor bolted to the front axle for a total system output of 484kW and 950Nm of torque. This cuts the 0-100km/h time down to a snappy 3.8 seconds while maximum speed increases to 220km/h. This extra performance does come at the cost of range, however, with the AMG EQS 53 4Matic+ offering 586km. Both EQS models can be charged with up to 200kW at fast charging stations with direct current. Set to launch locally in November, the EQS 450+ will cost R2,615,700 and the range-topping EQS 53 4Matic+ R3,410,100. These prices include a standard five-year/100,000km maintenance plan and 10-year battery warranty. TimesLIVE Support independent journalism by subscribing to the Sunday Times. Just R20 for the first month. Would you like to comment on this article? Register (it’s quick and free) or sign in now. Please read our Comment Policy before commenting. Read more at the SA government’s online coronavirus portal or use the 24-hour public hotline: 0800 029 999
Thank you for visiting nature.com. You are using a browser version with limited support for CSS. To obtain the best experience, we recommend you use a more up to date browser (or turn off compatibility mode in Internet Explorer). In the meantime, to ensure continued support, we are displaying the site without styles and JavaScript. Advertisement Scientific Reportsvolume 12, Article number: 14530 (2022) Cite this article Metrics details The use of people recognition techniques has become critical in some areas. For instance, social or assistive robots carry out collaborative tasks in the robotics field. A robot must know who to work with to deal with such tasks. Using biometric patterns may replace identification cards or codes on access control to critical infrastructures. The usage of Red Green Blue Depth (RGBD) cameras is ubiquitous to solve people recognition. However, this sensor has some constraints, such as they demand high computational capabilities, require the users to face the sensor, or do not regard users’ privacy. Furthermore, in the COVID-19 pandemic, masks hide a significant portion of the face. In this work, we present BRITTANY, a biometric recognition tool through gait analysis using Laser Imaging Detection and Ranging (LIDAR) data and a Convolutional Neural Network (CNN). A Proof of Concept (PoC) has been carried out in an indoor environment with five users to evaluate BRITTANY. A new CNN architecture is presented, allowing the classification of aggregated occupancy maps that represent the people’s gait. This new architecture has been compared with LeNet-5 and AlexNet through the same datasets. The final system reports an accuracy of 88%. User identification has become increasingly important in different research areas. For example, in the field of cybersecurity, to prevent access to critical facilities or in social and assistive robotics to improve Human-Robot Interaction (HRI). In the cybersecurity field, it is necessary to take into account that the number of cyber-attacks in different environments has increased exponentially in recent years1,2. On access control to critical infrastructures, cybercriminals have many techniques to gain access to facilities either remotely, by obtaining credentials, exploiting vulnerabilities in some of the systems, or physically, by breaching access to the facilities3,4. If the access is done remotely, they can be detected in the system when they start to perform malicious actions such as privilege escalation or lateral movements. These techniques are detected by analysing network traffic, system logs, or the system’s overall behaviour. Nevertheless, if the access is physical, an attack named tailgating5, a cybercriminal only could be detected by building employees or security personnel if it exists. Thus, more and more companies nowadays implement biometric systems in their infrastructure. The standard Radio Frequency Identification (RFID) cards or passcodes have become outdated. In robotics, the tasks that a mobile robot has to accomplish are becoming more complex, specifically if we focus on social or assistive robotics. These complex tasks are usually divided into little skills that the robot can solve. First, a robot needs to know its location in the environment where it operates6—this is known as localization. Then, it needs to calculate the best path avoiding obstacles or damaging people or objects in their trajectory7—aka navigation. Finally, the robot interacts with people and sometimes works with them on specific tasks8—aka Human-Robot Interaction (HRI). There are robust solutions for the first two skills because these areas have been extensively studied in the literature. The third one is probably the most complex skill, so many researchers are currently working on it. Human-Robot Interaction (HRI) has to be as similar as possible to human-human interaction9. Interaction refers to collision avoidance, but it also involves approaching skills or communication. Such elements are associated with two essential skills: people tracking and recognition. It is necessary to know where the people are every time, but it is also crucial to know who they are. Tracking people helps to improve navigation skills in mobile robots and promote socially acceptable robots10. Many solutions in the literature attempt to solve this problem with Red Green Blue Depth (RGBD) cameras to detect people in the environments as shown in11. Other researchers combine data from both Laser Imaging Detection and Ranging (LIDAR) and Red Green Blue Depth (RGBD) cameras12,13,14. However, these approaches have a high computing demand, and it may be a drawback if the tracking runs onboard a robot. Therefore, some solutions have been proposed in the literature to solve the tracking problem using 2D Laser Imaging Detection and Ranging (LIDAR) sensors. For example, the work15 reviewed different methods for robot navigation in crowded indoor environments. Furthermore, the clustering and centre point estimation combined with the walking centre line estimation is used to detect people with or without a walker16. The above approaches are not robust enough when dealing with occlusions or changes in gait speed. To address such issues, the authors proposed a Convolutional Neural Network (CNN)-based tool that allows for locating people within the robot surroundings using the data provided by a single Laser Imaging Detection and Ranging (LIDAR) sensor17. This tool, called People Tracking (PeTra), creates an occupancy map from the Laser Imaging Detection and Ranging (LIDAR) sensor’s readings. Maps are processed by a Convolutional Neural Network (CNN) which returns segmented data belonging to the people in the robot’s surroundings. A centre-of-mass calculation provides the people’s location estimates from the segmented data. Several versions of the People Tracking (PeTra) have been released. Then, it was included a correlation method of location estimates using Kalman filters, as well as an optimization for the Convolutional Neural Network (CNN)18. Finally, a bootstrapping method was proposed to improve the accuracy of the tool in specific locations19. People Tracking (PeTra) is the tool selected to detect people in this work. People recognition is a hot topic. It is not only required in mobile robotics, but also prevalent in our daily life. The use of biometry technologies is very extended. Biometry uses information about a specific part of the human body or behaviour, allowing us to distinguish people by analyzing such data20. Biometric technology splits into two main groups. The physiological biometric technologies analyze a specific feature of the body21. It is a well-known method since a significant part of society uses it daily. Within this group of techniques, we can find fingerprint22, facial23, or iris24 identification. On the other hand, behavioural biometric technologies analyze actions carried out by people25. In this second group, a time component is required since any action has a beginning, developing, and ending26. Within this group, we can find voice27, hand-writing28, or gait identification29. The last mentioned work presents a review of the methods used to capture gait information based on vision, sound, pressure, and accelerometry. Gait features can be extracted from a sequence of visual images or video, an underfoot pressure image sequence obtained using a pressure mat sensor, an acceleration trace recorded by an accelerometer in a wearable device, or an audio recording. As mentioned above, a robot must recognize the person interacting with to promote socially acceptable robots. In robotics, most studies use physiological biometric technologies—specifically face recognition using a camera30. However, this sensor has a critical drawback—data processing has a higher computational cost than other sensors. Furthermore, on face recognition, people should face the camera constantly. In addition, the worldwide COVID-19 situation and the consequent masks make this method even more complex. To meet such issues, some authors propose a multi-modal biometric identification combining face and voice identification31,32. Finally, it is essential to point out that the use of cameras bounds the users’ privacy33. Regarding Laser Imaging Detection and Ranging (LIDAR) sensors, several proposals use these sensors to perform human detection and tracking. This sensor solves the user privacy problem as well as the usability of the system, since the user does not have to constantly look at the robot. Recent studies analyze people’s gait using 2D and 3D Laser Imaging Detection and Ranging (LIDAR) sensors to improve the tracking of individuals. The work34 proposes an Long Short-Term Memory (LSTM)-based method for gait recognition using a multi-line Laser Imaging Detection and Ranging (LIDAR) sensor. The study proposes to create a silhouette from the point cloud extracted from the multi-line LIDAR and process it through an LTSM-based CNN network. The experimental results revealed that the proposed approach achieved a 60% of performance classification for 30 people. Benedek et al.35 presents two approaches, one for gait analysis and the other one for activity analysis, both based on data streams of a Rotating Multi-Beam (RMB) Laser Imaging Detection and Ranging (LIDAR) sensor. The gait analysis is used to do the person re-identification during tracking and recognition of specific activity patterns. They use a silhouette-based approach to projecting the 3D point cloud of a person obtained through the Rotating Multi-Beam (RMB) Laser Imaging Detection and Ranging (LIDAR) sensor to an image 2D plane. This image is preprocessed and evaluated through a Convolutional Neural Network (CNN). The experimental results revealed that the proposed approach achieved an average of 87% of performance classification for 28 people. Finally, a proposal to preserve the user’s privacy, the work36, uses a 2D Laser Imaging Detection and Ranging (LIDAR) sensor located at ankle level for people tracking. The study also performed a gait analysis to get person height estimation using Laser Imaging Detection and Ranging (LIDAR) data. In this work, we present Biometric RecognITion Through gAit aNalYsis (BRITTANY), a tool that allows for identifying people through gait analysis using a 2D Laser Imaging Detection and Ranging (LIDAR) sensor and a Convolutional Neural Network (CNN) to process its data. A 2D Laser Imaging Detection and Ranging (LIDAR) sensor was selected because of its low computational requirements and its benefits for users’ privacy. The gait analysis has been chosen because it is a behavioural biometry method. Physiological biometry-based systems only process data gathered in a specific time instant. On the other hand, behavioural biometry-based strategies collect input data during a time interval. It allows for analysing more than one sample of user data, so they get more robust evidence without using any other external identification source. The remainder of the paper organises as follows: “Materials and methods” section describes the materials and evaluation methods used to carry out our research; the results are presented and discussed in “Results and discussion” section; finally, conclusions and future works are proposed in “Conclusion” section. (a) Leon@Home Testbed. (b) Orbi-One Robot. (c) Leon@Home Testbed schema. The robot icons on the map point out the robot’s location and orientation during the experiments; the arrows show the trajectory of people. A set of experiments were carried out to evaluate Biometric RecognITion Through gAit aNalYsis (BRITTANY). In this section, the main elements of the research are in-depth depicted. Besides, we describe the methodology used to assess the accuracy of the proposed system. The experiments have been done in the mock-up apartment Leon@Home Testbed37, a certified testbed38 of the European Robotics League (ERL) located in the Robotics Group’s laboratory at the University of Leon—see Fig. 1a. It is used to test mobile service robots in a realistic environment. The apartment simulates a single-room home built in an 8 m (times) 7 m space. 60 cm-high walls—for allowing seeing—split the space into a living room, kitchen, bedroom, and bathroom. Orbi-One, the mobile service robot shown in Fig. 1b has been used to gather data. It is manufactured by Robotnik39. It accommodates several sensors, such as a Red Green Blue Depth (RGBD) camera, a Laser Imaging Detection and Ranging (LIDAR) sensor, and an inertial unit. It also operates a six-degrees-freedom manipulator arm attached to its torso and a wheeled base for moving around the floor. Inside, an Intel Core i7 CPU with 8 GB of RAM allows it to run the software to control the robot hardware. The software runs the Robot Operating System (ROS) framework40. Specifically, we used its onboard Laser Imaging Detection and Ranging (LIDAR) sensor to collect data for our research. People Tracking (PeTra)17 is developed by the Robotics Group at the University of León41 in recent years. People Tracking (PeTra) allows for locating people in the environment. It uses data provided by a Laser Imaging Detection and Ranging (LIDAR) sensor accommodated 20cm above the floor. It was evaluated by using an open-access dataset42. Starting from Laser Imaging Detection and Ranging (LIDAR) data People Tracking (PeTra) builds a 2D occupancy map that depicts the main features of the robot environment. Such occupancy map is then processed by a Convolutional Neural Network (CNN) that returns a new occupancy map containing only the points that belong to people. People Tracking (PeTra)’s Convolutional Neural Network (CNN) is based on the U-net architecture43, commonly used to perform biomedical image segmentation44. A centre-mass algorithm is computed over the new occupancy map to estimate the people’s location. New versions of the tool were released in later years. People Tracking (PeTra) can correlate location estimates by using Euclidean distances45 or using Kalman filters46—a more robust correlation method. An optimized design for the Convolutional Neural Network (CNN) that allows People Tracking (PeTra) for working in real-time18. Finally, a bootstrapping-based method that improves the accuracy at specific locations, such as empty rooms or corridors19. Biometric RecognITion Through gAit aNalYsis (BRITTANY) allows for recognizing people by their gait. The system is based on a Convolutional Neural Network (CNN) which uses an aggregation of occupancy maps provided by People Tracking (PeTra) as input. We pose that such aggregated occupancy maps are unique for each person and may be used to identify them. Aggregated occupancy maps are processed to get probability values for each legitimate user. For instance, for five people, Biometric RecognITion Through gAit aNalYsis (BRITTANY) might get [0.01, 0.96, 0.2, 0.24, 0.09] probability values, meaning that input data belongs to the first person with a 0.01 probability, to the second one with a 0.96 probability, to the third one with a 0.2 probability, to the fourth one with a 0.24 probability, and the fifth one with a 0.09 probability. Thus, we might assert that the input data belongs to the second person. We consider several predictions during a time interval to prevent punctual errors. Thus, we evaluate the final estimation through a set of predictions by applying a most-voted item strategy. Two datasets, available online47, have been compiled. First, we gathered data in the mock-up apartment at Leon@Home Testbed described in “Leon@Testbed” section. Data was collected from the Laser Imaging Detection and Ranging (LIDAR) sensor onboard the Orbi-One robot mentioned in “Orbi-One robot” section. Both datasets consist of Rosbag files, a Robot Operating System (ROS) feature that allows for recording data during a time interval and playing them later. The first dataset ((mathscr {D}_1)) is composed of 90 five-second Rosbag files. Data recorded correspond to a person walking straight in front of the robot. Each Rosbag file contains the data gathered by the Laser Imaging Detection and Ranging (LIDAR) sensor onboard the robot. We recorded data from five different people at three locations—shown in Fig. 1c on the testbed schema. We recorded six Rosbag files for each location and person. The second dataset ((mathscr {D}_2)) is composed of 108 Rosbag files. We recorded data from six people walking straight in front of the robot at three locations—see Fig. 1c. We recorded six Rosbag files for each location and person. Five out of those six people are the same in both datasets. The last one is not registered in the system. We use its data to evaluate the false-positive cases in the system. Once we have gait data recorded as Rosbag files, it is necessary to curate and tag them to use them for fitting the Convolutional Neural Network (CNN) in charge of people identification. (mathscr {D}_1), depicted in “Data gathering” section, have been used to train the Convolutional Neural Network (CNN). Since Biometric RecognITion Through gAit aNalYsis (BRITTANY) uses a Convolutional Neural Network (CNN) to identify people, we need to convert data from Rosbag files into images (mathscr {I}) that describe people’s gait. Image generation process is shown in Fig. 2. The Fig. 2a shows the Laser Imaging Detection and Ranging (LIDAR) data as yellow points for the real scene shown in Fig. 2b. The red arrow shows the location and orientation of the robot. First, we play each Rosbag file obtaining occupancy maps for each Laser Imaging Detection and Ranging (LIDAR) reading—see Fig. 2c. From the above occupancy maps, People Tracking (PeTra) provides a second occupancy map segmenting the points belonging to people—see Fig. 2d. Finally, People Tracking (PeTra)’s occupancy maps are aggregated. Such aggregation allows for depicting people’s gait—see Fig. 2e. Data curation process: (a) Laser Imaging Detection and Ranging (LIDAR) and People Tracking (PeTra) data visualized on Rviz—The red arrow shows the robot’s location an orientation, the yellow points show Laser Imaging Detection and Ranging (LIDAR) readings; (b) snapshot from Orbi-One robot camera; (c) occupancy map computed from Laser Imaging Detection and Ranging (LIDAR) data; (d) occupancy map computed by People Tracking (PeTra); and (e) occupancy map aggregation. A individual occupancy map is represented as an image (I), see Fig. 2d. In these images, white pixels represent a Laser Imaging Detection and Ranging (LIDAR) point belonging to a person, and black pixels represent 1) Laser Imaging Detection and Ranging (LIDAR) points belonging to objects, or 2) points where the Laser Imaging Detection and Ranging (LIDAR) sensor has not detected collisions. The final image ((mathscr {I})) is created by concatenating individual occupancy maps, see Fig. 2e. These occupancy maps are concatenated using the logical OR (||) operation. Equation (1) represents the operation performed to create the final aggregate occupancy maps. In the Equation, (mathscr {I}) represents the final image obtained from the concatenation of individual images (I), n is the number of I used in the aggregation, and s is the number of steps between successive images (I). Different aggregation settings have been evaluated to select the best one. They are named as (mathscr {C}_{n times s}), where (n in langle 5,10 rangle) is the number of Laser Imaging Detection and Ranging (LIDAR) readings used in the aggregation, and (s in langle 0,1,2 rangle) is the number of steps between successive readings. For instance, in (mathscr {C}_{5 times 2}), five Laser Imaging Detection and Ranging (LIDAR) readings are used by considering one out of three successive Laser Imaging Detection and Ranging (LIDAR) readings. Figure 3 show a sample of the resulting aggregated occupancy map for each setting schema. Aggregated occupancy maps for (a) (mathscr {C}_{5 times 0}), (b) (mathscr {C}_{5 times 1}), (c) (mathscr {C}_{5 times 2}), (d) (mathscr {C}_{10 times 0}), (e) (mathscr {C}_{10 times 1}), and (f) (mathscr {C}_{10 times 2}). Convolutional Neural Network (CNN) usage has increased in recent years since a large number of systems integrate them48. Convolutional Neural Network (CNN) identify features from tagged datasets. Such features are often imperceptible to humans. Biometric RecognITion Through gAit aNalYsis (BRITTANY) uses a classification Convolutional Neural Network (CNN) to identify people. It receives an occupancy map ((mathscr {I})) as input and returns a success rate for each person it was trained. To define the Convolutional Neural Network (CNN), Keras API49 have been used using TensorFlow50 as back-end. To carry out the image classification to be performed by BRITTANY, we propose a new neural network architecture, hereafter ”custom”. To evaluate its performance, we have selected two other well-known architectures to perform image classification LeNet-551 and AlexNet52. These two architectures have been selected because they are the first well-known architectures that solved image classification problems. Both architectures have been modified to process as input a 256×256 image and as output a Dense layer of 5. Other architectures such as VGG1653 have been tested, but due to the complexity in the deep layers, the model created did not generalize correctly to perform the image classification used by Biometric RecognITion Through gAit aNalYsis (BRITTANY). Figure 4, generated with Net2vis tool54, illustrates the three architectures, Fig. 4a represents the custom architecture proposed in this work, and Fig. 4b and c represents the architecture of LeNet and Alexnet respectively. In addition, Table 1 shows the number of trainable and non-trainable parameters for each proposed architectures. As can be seen, the custom architecture has a much lower number of trainable parameters than the other two well-known models. CNN architectures of (a) Custom, (b) LeNet, (c) AlexNet. The Convolutional Neural Networks (CNNs) models were trained on Caléndula the parallel computing cluster of Supercomputación Castilla y León (SCAYLE)55. Supercomputación Castilla y León (SCAYLE) is a public research centre dependent on the Community of Castilla y León (Spain) whose main activity is to support the improvement of R & D & I tasks. Six Convolutional Neural Network (CNN) models have been created for each architecture, one for each out of 6 aggregation settings ((mathscr {C}_{5 times 0}), (mathscr {C}_{5 times 1}), (mathscr {C}_{5 times 2}), (mathscr {C}_{10 times 0}), (mathscr {C}_{10 times 1}), and (mathscr {C}_{10 times 2})) depicted in “Data curation” section. In this way, a total of 18 Convolutional Neural Network (CNN) models have been trained. The evaluation was carried out using the (mathscr {D}_2)—see “Data gathering” section. We played each Rosbag file using Biometric RecognITion Through gAit aNalYsis (BRITTANY) with different setting schemas to evaluate the accuracy. We need to know whether or not the user has been recognized properly for each run. Such data allow us to obtain the confusion matrix that allows visualization of the performance of our tool with the six setting schemas defined and the three Convolutional Neural Network (CNN) architectures used, described in “Convolutional neural network design” section. Moreover, to evaluate the overall Biometric RecognITion Through gAit aNalYsis (BRITTANY)’s performance the following Key Performance Indicators (KPI)’s obtained through the confusion matrix are considered: Accuracy ((mathscr {A})), Precision ((mathscr {P})), Recall ((mathscr {R})), and F(_1)-score ((mathscr {F})). As the proposed method is a multi-class classification, it is necessary to calculate Key Performance Indicators (KPI)’s for each class. Then an arithmetic average is calculated to obtain the Key Performance Indicators (KPI)’s of the global system56(mathscr {A})—see Eq. (6)—measures the proportion of correct predictions, both positive and negative cases, among the total number of cases examined. (mathscr {A}_{k}) is calculated as shown Eq. (2). The (mathscr {P}) score—see Eq. (7)—shows the fraction of relevant instances among the retrieved instances. (mathscr {P}_{k}) is calculated as shown Eq. (3). The (mathscr {R}) score—see Eq. (8)—shows the rate of positive cases that were correctly identified by the algorithm. (mathscr {R}_{k}) is calculated as shown Eq. (4). Finally, the (mathscr {F}) score—see Eq. (9) is the harmonic mean of precision and recall. (mathscr {F}_{k}) is calculated as shown Eq. (5). In equations, TP represents the true-positive rate, TN is the true-negative rate, FP is the false-positive rate, FN is the false-negative rate and K the number of classes into which the model classifies. To evaluate the tradeoff between the TP and FP rates of each class, we have computed the Receiver Operating Characteristic (ROC) curve57 for each one of the six setting schemas defined and the three proposed architectures. Besides, the Area Under the Curve (AUC) has been calculated to depict how much the models can distinguish between classes. Key Performance Indicators (KPI)’s: Accuracy, Precision, Recall and F1-score, for each of the trained models and each configuration proposed ((mathscr {C}_{5 times 0}), (mathscr {C}_{5 times 1}), (mathscr {C}_{5 times 2}), (mathscr {C}_{10 times 0}), (mathscr {C}_{10 times 1}), and (mathscr {C}_{10 times 2})). Biometric RecognITion Through gAit aNalYsis (BRITTANY)’s evaluation was done as described in “Evaluation” section. We obtained a confusion matrix for each model (custom, LeNet and AlexNet) and each setting schema ((mathscr {C}_{5 times 0}), (mathscr {C}_{5 times 1}), (mathscr {C}_{5 times 2}), (mathscr {C}_{10 times 0}), (mathscr {C}_{10 times 1}), and (mathscr {C}_{10 times 2})). Figure 6, shows the confusion matrices for each model and setting schema. In the first row are the confusion matrices, in blue, for the custom models, in brown (second row) the confusion matrices for LeNet and in the third row, in green, the confusion matrices for AlexNet. From left ((mathscr {C}_{5 times 0})) to right ((mathscr {C}_{10 times 2})) are the different configurations used. Every confusion matrix consists of rows and columns representing user identifiers. The matrices check situations where BRITTANY provided a correct or wrong outcome using each model respectively. A perfect system would have all the values on the main diagonal. According to the values shown in Fig. 6, the Key Performance Indicators (KPI)’s, the Receiver Operating Characteristic (ROC) curve and the Area Under the Curve (AUC) have been calculated for each of the architectures and setting schemas. These Key Performance Indicators (KPI)’s are presented in Fig. 5 that show the Accuracy ((mathscr {A}))—Fig. 5a, Precision ((mathscr {P}))—Fig. 5b, Recall ((mathscr {R}))—Fig. 5c, and F(_1)-score ((mathscr {F}))—Fig. 5d, for each model proposed and each setting schema. Moreover in Fig. 7 are presented the Receiver Operating Characteristic (ROC) curves for each model and settting schema. In the first row Receiver Operating Characteristic (ROC) curves for the custom models, in the second row Receiver Operating Characteristic (ROC) curves for LeNet and in the third row Receiver Operating Characteristic (ROC) curves for AlexNet. From left ((mathscr {C}_{5 times 0})) to right ((mathscr {C}_{10 times 2})) are the different configurations used. The Receiver Operating Characteristic (ROC) curves have been created for each user in the system (U0 – U4) and the not registered user (!U), in this way, it is also calculated the Area Under the Curve (AUC) for each user, model and setting schema. Confusion matrices for each architecture: Custom in blue (first row), LeNet in brown (second row) and AlexNet in green (third row). From left to right the different configurations used: (a) (mathscr {C}_{5 times 0}), (b) (mathscr {C}_{5 times 1}), (c) (mathscr {C}_{5 times 2}), (d) (mathscr {C}_{10 times 0}), (e) (mathscr {C}_{10 times 1}), and (f) (mathscr {C}_{10 times 2}). Receiver Operating Characteristic (ROC) curves and Area Under the Curve (AUC) for custom (first row), LeNet (second row) and AlexNet (third row). From left to right the different configurations used: (a) (mathscr {C}_{5 times 0}), (b) (mathscr {C}_{5 times 1}), (c) (mathscr {C}_{5 times 2}), (d) (mathscr {C}_{10 times 0}), (e) (mathscr {C}_{10 times 1}), and (f) (mathscr {C}_{10 times 2}). Focusing on Fig. 5a, we see that accuracy scores that measure the proportion of correct (both positive and negative) predictions among the total number of cases examined. The accuracy score is only higher than 0.8, specifically 88%, with the (mathscr {C}_{10 times 1}) schema using the custom model. The accuracy scores in the schemas for the custom model are between 47% and 57%. The accuracy of LeNet and AlexNet for each schema is much lower than that obtained with the custom model, obtaining values between 19% and 30%. Except for the (mathscr {C}_{10 times 2}) schema where LeNet obtains the same value as custom (53%). The precision ((mathscr {P})), see Fig. 5b, represents the fraction of relevant instances among the retrieved samples. In this case, most of the values are higher than 50% for all the models; only the model AlexNet with schema (mathscr {C}_{10 times 2}) reports a precision of 30%. The two models with a better precision are LeNet with the schema (mathscr {C}_{5 times 0}) and custom with the schema (mathscr {C}_{10 times 1}), for both models, the precision score is 88%. The recall score ((mathscr {R}))—also called sensitivity or true positive rate—, see Fig. 5c is the ratio of positive instances correctly detected by the algorithm. In this score, the maximum value, 88%, is again for the custom model and (mathscr {C}_{10 times 1}) schema. The recall scores in the schemas for the custom model are between 47% and 57%. The recall of LeNet and AlexNet for each schema report values between 19% and 53%. It is often convenient to combine precision and recall into a single metric, see Fig. 5d. The (F_1) score ((mathscr {F})) is the harmonic mean of (mathscr {P}) and (mathscr {R}). Whereas the regular mean treats all values equally, the harmonic mean gives much more weight to low values. As a result, the classifier will only get a high (F_1) score if both recall and precision are high. The model with the best (F_1) score is the custom using the schema (mathscr {C}_{10 times 1}), specifically 88%. The remaining schemas for the custom model have a (F_1) score between 48% and 59%. The (F_1) score of LeNet and AlexNet for each schema is much lower than that obtained with the custom model, obtaining values between 22% and 35%. Except for the (mathscr {C}_{10 times 2}) schema where LeNet obtains the same value as custom (53%). The model with the best Key Performance Indicators (KPI)’s is custom using the schema (mathscr {C}_{10 times 1}), all the Key Performance Indicators (KPI)’s reports a score of 88%. Then, focusing on the confusion matrix of the custom model and the best schema, (mathscr {C}_{10 times 1}), shown in Fig. 6 (first row, fifth column), we see that most of the values are in the main diagonal. However, there are some errors. U1 was the only correctly identified user in all cases—we have 18 cases, six possible users at three different locations. U0 user was recognised as U0 in 17 cases. However, there is one case where U0 was not recognised as a registered user (!U). U2 was identified correctly in 16 cases, and he was not recognised (!U) in 2. U3 was correctly identified in all cases but one, where he was recognised as U4. It is important to point out that this is the only case in the evaluation of the (mathscr {C}_{10 times 1}) schema and the custom model where two registered users were mistaken. The results for U4 are the worst in the evaluation. In 15 cases, the user was correctly identified, but in 3 cases, he was not recognised (!U). Finally, a non-registered user was used to test the Biometric RecognITion Through gAit aNalYsis (BRITTANY)’s robustness in front of unknown users. Such a user was wrongly recognised as U3 in 1 case. In the remaining 17 cases, he was correctly identified as non-registered. Focusing on the Receiver Operating Characteristic (ROC) curves for each of the models obtained, see Fig. 7. It can be seen that the best representation of the Receiver Operating Characteristic (ROC) curves corresponds to the custom model and the (mathscr {C}_{10 times 1}) schema (first row, fifth column). The quality of the model increases when the curve moves towards the upper left corner of the graph. This is because it improves its TP rate, also minimising the FP rate. Moreover, the Area Under the Curve (AUC) values are used as a summary of the model’s performance. The more curve moves towards the upper left corner of the graph, the more area is contained under it and therefore, the classifier is better. A perfect classifier has an Area Under the Curve (AUC) of 1. The Area Under the Curve (AUC)’s for each user obtained from BRITTANY using the custom model and the (mathscr {C}_{10 times 1}) schema are (0.97, 1.00, 0.94, 0.97, 0.91 and 0.94) respectively, all of them higher than 90%. Finally, the accuracy obtained from Biometric RecognITion Through gAit aNalYsis (BRITTANY) using the custom model and the (mathscr {C}_{10 times 1}) schema is 88%. Focussing on works presented in the Introduction that applied biometry technologies, the work34 creates a silhouette from the point cloud extracted from the multi-line LIDAR and processes it through an LTSM-based CNN network obtaining an accuracy of 60%. The work35 uses gait analysis to do person re-identification, using the silhouette obtained from the projection of the 3D point cloud of a person to a 2D image. This method obtains an accuracy of 87%. It should be noted that those works use a 3D LIDAR instead of a 2D LIDAR. The number of values provided by a 2D LIDAR sensor is much smaller than the ones provided by a 3D LIDAR, so it is easier to process data. This fact facilitates the use of the final system in real-time. Moreover, the models used in those works have not been evaluated against users outside the system. Therefore, people who are not registered in the system could be classified as legitimate users of it. This paper presents Biometric RecognITion Through gAit aNalYsis (BRITTANY), a system that identifies people by analyzing their gait. Thus, the system is based on behavioural biometric technologies characterized for analyzing the features of a specific action performed by a person. This system processes sensor data obtained in real-time. A Laser Imaging Detection and Ranging (LIDAR) sensor was chosen because of its low computational demand as well as the privacy it provides. The Laser Imaging Detection and Ranging (LIDAR) readings are processed by People Tracking (PeTra) to create an occupational map segmenting the points that belong to people. Then, such segmented occupational maps are aggregated to build an image of people’s gait. Aggregated occupancy maps are processed by a Convolutional Neural Network (CNN) model that outcomes the user identifier that corresponds to the person in front of the robot. The final prediction depends on several estimations by applying a voting strategy to prevent errors. Biometric RecognITion Through gAit aNalYsis (BRITTANY) can be used in several applications on cooperative robotics and raises Human-Robot Interaction (HRI) since it allows the robot to “know” the people around him. Moreover, at indoor environments, the robot could detect foreigners and alert their presence. Besides, it also can be used to control access to critical infrastructures, making it more difficult for cybercriminals to carry out tailgating attacks. The evaluation was done by analyzing several setting schemas named (mathscr {C}_{n times s}) with three Convolutional Neural Network (CNN) architectures, one of them is proposed in this work, called ”custom” and the other two are well-known architectures (LeNet and AlexNet). The dataset (mathscr {D}_2) was used to measure the performance. It compiles 108 Rosbag files—Six recordings for six users at three different locations. Five users (U0–4) are well-known people. The last one (!U) is unknown to the system and was used to evaluate the system’s performance in front of strange people. The (mathscr {C}_{10 times 1}) schema using the custom model gets the best results in all the Key Performance Indicators (KPI)’s computed. Such schema builds images by aggregating ten segmented occupancy maps taking one out of two. This schema provides an accuracy score of 88%. As previously mentioned, this work is a Proof of Concept (PoC) for indoor environments with few people. We aim to determine if it is possible to identify people by their gait using a 2D LIDAR sensor to maintain the user’s privacy and reduce computational load. In future work, we propose to collect data from more users to evaluate Biometric RecognITion Through gAit aNalYsis (BRITTANY) as an authentication tool. We want to point out that all the datasets generated are available online47. Besides, The source code developed during the current study is available under an open-source license in the GitHub repository58. Finally, a docker image with all required software to double-check the evaluation posed in this paper is also available online59. The datasets generated and/or analysed during the current study are available in the “Dataset for train and test BRITTANY (Biometric RecognITion Through gAit aNalYsis)” repository, 10.5281/zenodo.5825885. Ulsch, M. Cyber Threat!: How to Manage the Growing Risk of Cyber Attacks (Wiley Online Library, 2014). Book Google Scholar Raiyn, J. et al. A survey of cyber attack detection strategies. Int. J. Secur. Appl.8, 247–256 (2014). Google Scholar Ogie, R. I. Cyber security incidents on critical infrastructure and industrial networks, in Proceedings of the 9th International Conference on Computer and Automation Engineering, 254–258 (2017). Salahdine, F. & Kaabouch, N. Social engineering attacks: A survey. Future Internet11, 89 (2019). Article Google Scholar Maan, P. & Sharma, M. Social engineering: A partial technical attack. Int. J. Comput. Sci. Issues9, 557–559 (2012). Google Scholar Panchpor, A. A., Shue, S. & Conrad, J. M. A survey of methods for mobile robot localization and mapping in dynamic indoor environments, in 2018 Conference on Signal Processing And Communication Engineering Systems (SPACES), 138–144 (IEEE, 2018). Cheng, J., Cheng, H., Meng, M. Q.-H. & Zhang, H. Autonomous navigation by mobile robots in human environments: A survey, in 2018 IEEE International Conference on Robotics and Biomimetics (ROBIO), 1981–1986 (IEEE, 2018). Richert, A., Müller, S., Schröder, S. & Jeschke, S. Anthropomorphism in social robotics: Empirical results on human–robot interaction in hybrid production workplaces. AI Soc.33, 413–424 (2018). Article Google Scholar Fox, J. & Gambino, A. Relationship development with humanoid social robots: Applying interpersonal theories to human–robot interaction. Cyberpsychol. Behav. Soc. Netw.24, 294–299 (2021). Article Google Scholar Lobato, C., Vega-Magro, A., Núñez, P. & Manso, L. J. Human-robot dialogue and collaboration for social navigation in crowded environments, in 2019 IEEE International Conference on Autonomous Robot Systems and Competitions (ICARSC), 1–6 (IEEE, 2019). Wang, Y., Wei, X., Shen, H., Ding, L. & Wan, J. Robust fusion for RGB-D tracking using CNN features. Appl. Soft Comput.92, 106302 (2020). Article Google Scholar Matti, D., Ekenel, H. K. & Thiran, J.-P. Combining lidar space clustering and convolutional neural networks for pedestrian detection, in 2017 14th IEEE International Conference on Advanced Video and Signal Based Surveillance (AVSS), 1–6 (IEEE, 2017). Bu, F., Le, T., Du, X., Vasudevan, R. & Johnson-Roberson, M. Pedestrian planar lidar pose (PPLP) network for oriented pedestrian detection based on planar lidar and monocular images. IEEE Robot. Autom. Lett.5, 1626–1633 (2019). Article Google Scholar Linder, T. & Arras, K. O. People detection, tracking and visualization using ROS on a mobile service robot. In Robot Operating System (ROS) (ed. Koubaa, A.) 187–213 (Springer, 2016). Chapter Google Scholar Rios-Martinez, J., Spalanzani, A. & Laugier, C. From proxemics theory to socially-aware navigation: A survey. Int. J. Soc. Robot.7, 137–153. https://doi.org/10.1007/s12369-014-0251-1 (2015). Article Google Scholar Duong, H. T. & Suh, Y. S. Human gait tracking for normal people and walker users using a 2D lidar. IEEE Sens. J.20, 6191–6199 (2020). ADSArticle Google Scholar Guerrero-Higueras, Á. M. et al. Tracking people in a mobile robot from 2D lidar scans using full convolutional neural networks for security in cluttered environments. Front. Neurorobot.12, 85 (2018). Article Google Scholar Álvarez-Aparicio, C. et al. People detection and tracking using LIDAR sensors. Robotics8, 75 (2019). Article Google Scholar Álvarez-Aparicio, C. et al. Convolutional neural networks refitting by bootstrapping for tracking people in a mobile robot. Appl. Sci.11, 10043 (2021). Article Google Scholar Jain, A., Hong, L. & Pankanti, S. Biometric identification. Commun. ACM43, 90–98 (2000). Article Google Scholar Adeoye, O. S. A survey of emerging biometric technologies. Int. J. Comput. Appl.9, 1–5 (2010). Google Scholar Valdes-Ramirez, D. et al. A review of fingerprint feature representations and their applications for latent fingerprint identification: Trends and evaluation. IEEE Access7, 48484–48499 (2019). Article Google Scholar Mane, S. & Shah, G. Facial recognition, expression recognition, and gender identification. In Data Management, Analytics and Innovation (eds Balas, V. et al.) 275–290 (Springer, 2019). Chapter Google Scholar Patil, C. M. & Gowda, S. An approach for secure identification and authentication for biometrics using iris, in 2017 International Conference on Current Trends in Computer, Electrical, Electronics and Communication (CTCEEC), 421–424 (IEEE, 2017). Obaidat, M. S., Traore, I. & Woungang, I. Biometric-Based Physical and Cybersecurity Systems Vol. 368 (Springer, 2019). Book Google Scholar Xiao, Q. Security issues in biometric authentication, in Proceedings from the Sixth Annual IEEE SMC Information Assurance Workshop, 8–13 (IEEE, 2005). Menshakou, P. & Murashko, I. Voice user identification in access control systems, in Proceedings of International Conference on Open Semantic Technologies for Intelligent Systems (OSTIS-2017). Minsk: BSUIR, 175–178 (2017). Mohammed, A. A., Abdul-Hassan, A. K. & Mahdi, B. S. Authentication system based on hand writing recognition, in 2019 2nd Scientific Conference of Computer Sciences (SCCS), 138–142 (IEEE, 2019). Connor, P. & Ross, A. Biometric recognition by gait: A survey of modalities and features. Comput. Vis. Image Underst.167, 1–27 (2018). Article Google Scholar Petrescu, R. V. Face recognition as a biometric application. J. Mechatron. Robot.3, 237–257 (2019). Article Google Scholar Ouellet, S., Grondin, F., Leconte, F. & Michaud, F. Multimodal biometric identification system for mobile robots combining human metrology to face recognition and speaker identification, in The 23rd IEEE International Symposium on Robot and Human Interactive Communication, 323–328 (2014). https://doi.org/10.1109/ROMAN.2014.6926273. Al-Qaderi, M. K. & Rad, A. B. A multi-modal person recognition system for social robots. Appl. Sci.8, 387 (2018). Article Google Scholar Karri, C., Cheikhrouhou, O., Harbaoui, A., Zaguia, A. & Hamam, H. Privacy preserving face recognition in cloud robotics: A comparative study. Appl. Sci.11, 6522 (2021). CASArticle Google Scholar Yamada, H., Ahn, J., Mozos, O. M., Iwashita, Y. & Kurazume, R. Gait-based person identification using 3D lidar and long short-term memory deep networks. Adv. Robot.34, 1201–1211 (2020). Article Google Scholar Benedek, C., Gálai, B., Nagy, B. & Jankó, Z. Lidar-based gait analysis and activity recognition in a 4D surveillance system. IEEE Trans. Circuits Syst. Video Technol.28, 101–113 (2016). Article Google Scholar Hasan, M. et al. Tracking people using ankle-level 2D lidar for gait analysis, in International Conference on Applied Human Factors and Ergonomics, 40–46 (Springer, 2020). Robotics Group of Universidad de León. Leon@home Testbed (accessed 28 April 2022). https://robotica.unileon.es/index.php?title=Testbed (2022). EU Robotics. ERL Certified Test Beds (accessed 28 April 2022). https://www.eu-robotics.net/robotics_league/erl-service/certified-test-beds/index.html (2022). Robotnik. Robotnik homepage (accessed 28 April 2022). https://robotnik.eu/es/ (2022). Quigley, M. et al. ROS: An open-source robot operating system, in ICRA Workshop on Open Source Software, vol. 3, 5 (Kobe, Japan, 2009). Robotics Group of Universidad de Léon. Robotics Group homepage (accessed 28 April 2022). https://robotica.unileon.es/ (2022). Álvarez-Aparicio, C. et al. Benchmark dataset for evaluation of range-based people tracker classifiers in mobile robots. Front. Neurorobot.11, 72 (2018). Article Google Scholar Ronneberger, O., Fischer, P. & Brox, T. U-net: Convolutional networks for biomedical image segmentation, in Medical Image Computing and Computer-Assisted Intervention (MICCAI), vol. 9351 of LNCS, 234–241 (Springer, 2015). Long, J., Shelhamer, E. & Darrell, T. Fully convolutional networks for semantic segmentation, in IEEE Conference on Computer Vision and Pattern Recognition (CVPR), 3431–3440 (2015). https://doi.org/10.1109/CVPR.2015.7298965. Álvarez-Aparicio, C. et al. Lidar-based people detection and tracking for home competitions, in 2019 IEEE International Conference on Autonomous Robot Systems and Competitions (ICARSC), 1–6 (IEEE, 2019). Alvarez-Aparicio, C., Guerrero-Higueras, A. M., Rodr, F. J. & Mart, F. Detección y seguimiento de personas utilizando sensores lidar, in Jornadas Nacionales de Robótica Spanish Robotics Conference, 234–240 (2019). Dataset 10.5281/zenodo.5825885 (accessed 12 January 2022). https://doi.org/10.5281/zenodo.5825885 (2022). Mane, D. & Kulkarni, U. V. A survey on supervised convolutional neural network and its major applications, in Deep Learning and Neural Networks: Concepts, Methodologies, Tools, and Applications, 1058–1071 (IGI Global, 2020). Keras. Keras homepage (accessed 28 April 2022). https://keras.io/ (2022). TensorFlow. TensorFlow homepage (accessed 28 April 2022). https://www.tensorflow.org/ (2022). LeCun, Y. et al. Lenet-5, convolutional neural networks. http://yann.lecun.com/exdb/lenet20, 14 (2015). Krizhevsky, A., Sutskever, I. & Hinton, G. E. Imagenet classification with deep convolutional neural networks. Adv. Neural Inf. Process. Syst.25, 1–9 (2012). Google Scholar Simonyan, K. & Zisserman, A. Very deep convolutional networks for large-scale image recognition. arXiv preprint arXiv:1409.1556 (2014). Bäuerle, A., van Onzenoodt, C. & Ropinski, T. Net2vis—A visual grammar for automatically generating publication-tailored CNN architecture visualizations. IEEE Trans. Visual Comput. Graph.27, 2980–2991. https://doi.org/10.1109/TVCG.2021.3057483 (2021). Article Google Scholar SCAYLE. Scayle (accessed 28 April 2022) (2022). https://www.scayle.es/. Grandini, M., Bagli, E. & Visani, G. Metrics for multi-class classification: An overview. arXiv preprint arXiv:2008.05756 (2020). Fawcett, T. An introduction to roc analysis. Pattern Recogn. Lett.27, 861–874 (2006). ADSArticle Google Scholar C.Álvarez-Aparicio. BRITTANY (Biometric RecognITion Through gAitaNalYsis) (accessed 28 April 2022) (2022). https://github.com/ClaudiaAlvarezAparicio/brittany. C.Álvarez-Aparicio. BRITTANY Docker image (accessed 28 April 2022) (2022). https://hub.docker.com/r/claudiaalvarezaparicio/brittany. Download references The research described in this article has been funded by the Instituto Nacional de Ciberseguridad de España (INCIBE), under the grant ”ADENDA 4: Detección de nuevas amenazas y patrones desconocidos (Red Regional de Ciencia y Tecnología)”, addendum to the framework agreement INCIBE-Universidad de León, 2019-2021. Miguel Ángel González-Santamarta would like to thank Universidad de León for its funding support for his doctoral studies. Department of Mechanical, Computer Science and Aerospace Engineering, University of León, 24071, León, Spain Claudia Álvarez-Aparicio, Ángel Manuel Guerrero-Higueras, Miguel Ángel González-Santamarta, Adrián Campazas-Vega, Vicente Matellán & Camino Fernández-Llamas You can also search for this author in PubMedGoogle Scholar You can also search for this author in PubMedGoogle Scholar You can also search for this author in PubMedGoogle Scholar You can also search for this author in PubMedGoogle Scholar You can also search for this author in PubMedGoogle Scholar You can also search for this author in PubMedGoogle Scholar All authors contributed to the study conception and design. Material preparation, data collection and analysis were performed by C.Á-A, Á.M.G-H, M.Á.G-S and A.C-V. The first draft of the manuscript was written by C.Á-A and Á.M.G-H and all authors commented on previous versions of the manuscript. The supervision was done by V.M. The project management and the funding acquisition were supplied by C.F-L. All authors read and approved the final manuscript. Correspondence to Claudia Álvarez-Aparicio. The authors declare no competing interests. Springer Nature remains neutral with regard to jurisdictional claims in published maps and institutional affiliations. Open Access This article is licensed under a Creative Commons Attribution 4.0 International License, which permits use, sharing, adaptation, distribution and reproduction in any medium or format, as long as you give appropriate credit to the original author(s) and the source, provide a link to the Creative Commons licence, and indicate if changes were made. The images or other third party material in this article are included in the article’s Creative Commons licence, unless indicated otherwise in a credit line to the material. If material is not included in the article’s Creative Commons licence and your intended use is not permitted by statutory regulation or exceeds the permitted use, you will need to obtain permission directly from the copyright holder. To view a copy of this licence, visit http://creativecommons.org/licenses/by/4.0/. Reprints and Permissions Álvarez-Aparicio, C., Guerrero-Higueras, Á.M., González-Santamarta, M.Á. et al. Biometric recognition through gait analysis. Sci Rep12, 14530 (2022). https://doi.org/10.1038/s41598-022-18806-4 Download citation Received: Accepted: Published: DOI: https://doi.org/10.1038/s41598-022-18806-4 Anyone you share the following link with will be able to read this content: Sorry, a shareable link is not currently available for this article.
Earbuds that put sound quality above all else I’ve been a contributing editor for PCMag since 2011. Before that, I was PCMag’s lead audio analyst from 2006 to 2011. Even though I’m a freelancer now, PCMag has been my home for well over a decade, and audio gear reviews are still my primary focus. Prior to my career in reviewing tech, I worked as an audio engineer—my love of recording audio eventually led me to writing about audio gear. The Yamaha TW-E5B earphones lack extra features, but offer solid Bluetooth codec support and high-quality audio performance for the price. Yamaha’s TW-E5B true wireless earphones ($149.95) are somewhat rare in their simplicity; they don’t have a particularly sports-focused design or boast active noise cancellation (ANC). Instead, the cornerstone is primarily the audio experience. And we’re pleased with the balanced-but-sculpted sound signature, the strong Bluetooth codec support, and the adjustable five-band EQ in the companion app. These are an ideal pair for home listening, though they can also work in a pinch for workout sessions because of their modest waterproof rating. If you want a bit more out of your earbuds, the Sennheiser CX Plus True Wireless ($179.99) is a worthwhile alternative with ANC and strong audio chops. The Editors’ Choice-winning Anker Soundcore Space A40 ($99.99) offer a broader set of features for a bit less money. Available in black, white, blue, or brown, the TW-E5B earpieces are relatively large and fit well without earfins. The outer panels feature a crosshatch-textured surface along with the Yamaha tuning fork logo. The box includes four pairs of silicone eartips in various sizes. These should stay in your ears during more vigorous activity, such as running, but other pairs are much more suitable for exercise. Internally, 7mm dynamic drivers deliver a frequency range of 20Hz to 20KHz. The earphones are compatible with Bluetooth 5.2, plus support the AAC, AptX Adaptive, and SBC Bluetooth codecs—plenty of competing in-ears work with only either AAC or AptX, so we appreciate this versatility. The left and right earpieces have push-button controls on their top edges—one button sits on the left earpiece and two reside on the right one. The left earpiece’s button handles playback (single press), toggles the ambient sound mode (double press), and manages calls (press and hold). The right earpiece’s controls are for volume (single press) and track navigation (double press). We’re generally not fans of combining these two functions on the same button—it’s far too easy to accidentally skip a track when you mean to adjust the volume—but we like that volume control is an option at all. The two small buttons on the right earpiece can also be a tad difficult to pick out by touch. Capacitive touch panels might have been a more graceful solution overall. The IPX5 water-resistance rating is modest for in-ears without active noise cancellation—plenty of similarly priced (and far less expensive) models have fully waterproof builds. Jabra’s Elite 7 Pro ($199.99) and Elite 7 Active ($179.99) are suitable alternatives if you need a more durable design; both models sport an IP57 rating and ANC. Regardless, this Yamaha pair can withstand splashes and jets of modest water pressure from any direction. You just can’t submerge the earpieces or clean them off under a faucet. The rating also doesn’t apply to the charging case, so make sure to fully dry the earpieces before you dock them. The charging case is a bit large and doesn’t offer any particular advantages to make up for its bulk. The design is at least handsome—the flip-top lid sports the same textured surface as the earpieces. The back panel houses a USB-C port for the included USB-A-to-USB-C cable. Yamaha estimates that the TW-E5B earbuds can last roughly eight-and-a-half hours per charge and that the case holds an additional 21.5 hours of battery life. Your results will vary based on your typical listening volume level. The Yamaha Headphone Control app (available for Android and iOS) is easy to use and well-designed—you can download firmware updates, consult the user guide, and customize (or turn off) the auto-power-off function here. The main screen shows a battery life estimate for each earpiece and a five-band adjustable EQ. We wish you could save EQ presets, but we’re glad that a customizable EQ is available at all. Finally, you can also toggle the Listening Care feature—at lower volumes, it adjusts the sound signature to emphasize certain frequencies (typically the lows) that sound quieter. In the app, you can also toggle ambient sound and gaming modes (the latter reduces latency). There’s nothing spectacular about the app, but all the important options are present—an adjustable EQ, firmware updates, and some basic control settings. We tested the TW-E5B earphones with the EQ set to neutral and the Listening Care DSP function set to off. On tracks with intense sub-bass content, like The Knife’s “Silent Shout,” the pair delivers plenty of low-frequency rumble without going overboard; the drivers don’t distort even at maximum listening levels, either. If you want additional rumble, you can always dial up the lows via the in-app EQ. Bill Callahan’s “Drover,” a track with far less deep bass in the mix, gives us a better sense of the in-ears’ general sound signature. The drums on this track get some additional bass depth. They sound round and full, though never veer into unnaturally thunderous territory. Callahan’s baritone vocals benefit from a balanced mix of low-mid richness and high-mid crispness, while the higher-register percussive hits and acoustic strums have a bright, detailed presence. The sculpting and boosting throughout the frequency range are noticeable, but we like the end result: a rich bass response and solid high-frequency clarity. On Jay-Z and Kanye West’s “No Church in the Wild,” the kick drum loop receives an ideal high-mid presence, which allows its attack to retain its punch. Meanwhile, the vinyl hiss and crackle in the background take a slight step forward in the mix. The sub-bass synth hits that punctuate the beat come across with serious depth, as does the drum loop. These powerful lows don’t overpower the balance of the mix, however. The vocals on this track exhibit ideal clarity—they sound crisp without much additional sibilance. Orchestral tracks, like the opening scene from John Adams’ The Gospel According to the Other Mary, sound excellent. The lower-register instrumentation gets a suitable amount of bass presence—its subtle anchoring role doesn’t sound very exaggerated here—and the higher-register brass, strings, and vocals are wonderfully detailed and clear. The mic quality is fine but not overly impressive. We could understand every word of a test recording from our iPhone, but we noticed some Bluetooth audio artifacts in the signal. Nevertheless, you shouldn’t have any issues with calls over a reliable cell connection. The Yamaha TW-E5B earbuds deliver an excellent audio experience for the price, plus support a solid range of Bluetooth codecs. They might even offer the best sound of any in-ears in the under-$150 segment. You just have to give up active noise cancellation and top-tier levels of durability. As mentioned, we’re also fans of the more well-rounded Sennheiser CX Plus True Wireless and Anker Soundcore Space A40, both of which boast active noise cancellation. And, if you don’t want to spend for Jabra’s most expensive fitness-friendly models, the Jabra Elite 3 ($79) is an excellent, no-frills alternative for about half the price of the Yamaha pair. The Yamaha TW-E5B earphones lack extra features, but offer solid Bluetooth codec support and high-quality audio performance for the price. Sign up for Lab Report to get the latest reviews and top product advice delivered right to your inbox.
Cornell offers ambitious 2022-23 fine arts season Cornell College’s fine arts departments have returned to a full performance and exhibition schedule for 2022-23. Among the highlights of an ambitious year are a large production of “Evita” and a retrospective exhibit by Professor Emeritus of Art Tony Plaut ’78. Up-to-date information on all the performances and exhibits can be found on Cornell’s new campus calendar, filtered by the category of fine arts. Members of the public and the campus community can now subscribe to the full fine arts calendar, or choose among music, art, and/or theatre and dance events calendars to receive periodic email updates. Viewers also can download events directly to their personal calendars. Theatre and dance productions Theatre performances require tickets, and box office information is included in the calendar listings. Music performances In addition to “Evita” (above), the spring semester schedule is still in development. The Music Department’s European tour takes place Block 9, and many of the works the ensembles will perform during the year will be German, Czech, and American music for their tour repertoire. Art exhibitions Tags: art & art history, music, theatre Cornell College 600 First Street SW Mount Vernon, IA 52314
Thank you for visiting nature.com. You are using a browser version with limited support for CSS. To obtain the best experience, we recommend you use a more up to date browser (or turn off compatibility mode in Internet Explorer). In the meantime, to ensure continued support, we are displaying the site without styles and JavaScript. Advertisement Scientific Reportsvolume 12, Article number: 14529 (2022) Cite this article Metrics details Molecular hydrogen, among other simple calculable atomic and molecular systems, possesses a huge advantage of having a set of ultralong living rovibrational states that make it well suited for studying fundamental physics. Further experimental progress will require trapping cold H2 samples. However, due to the large energy of the first electronic excitation, the conventional approach to finding a magic wavelength does not work for H2. We find a rovibrational transition for which the AC Stark shift is largely compensated by the interplay between the isotropic and anisotropic components of polarizability. The residual AC Stark shift can be completely eliminated by tuning the trapping laser to a specific “magic wavelength” at which the weak quadrupole polarizability cancels the residual dipole polarizability. Accurate spectroscopy of simple calculable atomic and molecular systems has proven its importance for studying fundamental physics and testing quantum theory. A particularly important role has been played by atomic hydrogen. In addition to its large contribution to the development and tests of quantum electrodynamics, accurate spectroscopy of atomic hydrogen provides the energy scale for ab initio quantum calculations (the Rydberg constant) and gives an important contribution to the global adjustment of fundamental constants1. Several other calculable systems, such as helium atom2,3, HD+ ion4,5, exotic atoms6,7,8 or hydrogen molecule, contribute to testing quantum theory, determining fundamental constants and searching for new physics beyond the standard model9,10,11. When considering a long-term perspective, H2 possesses a huge advantage over other system, which is a set of a few hundred ultralong (a week) living rovibrational states12. The ratio of the natural linewidth to the optical transition frequency is on the order of (10^{-20}) which, for a typical ability of resolving a (10^{-4}) fraction of the linewidth, gives the ultimate limit on testing fundamental physics with H2 at (10^{-24}) relative accuracy. Fast progress in molecular hydrogen spectroscopy was triggered by implementing optical frequency combs over a decade ago. The present most accurate measurements were obtained with infrared-ultraviolet double resonance spectroscopy in molecular beam13,14 and cavity-enhanced spectroscopy: for HD, the sub-Doppler saturation technique was implemented15,16, while for homonuclear isotopologues, due to the lack of dipole transitions, Doppler-limited techniques were used17,18 (the Doppler-limited technique was also used for HD19,20). The highest accuracy, 13 kHz, was obtained for the HD isotopologue13. The factors that limit the accuracy depend on the approach used. For instance, for HD molecular beam experiments, the accuracy is limited by the residual first-order Doppler shift to the 12 kHz level13. To maintain the fast progress in H2 rovibrational spectroscopy and progress towards the fundamental limitation, a cold H2 sample has to be trapped in an optical lattice. The first attempt to manipulate the H2 velocity with a laser field was demonstrated in Ref.21. Recent progress in laser technology already gives the capability to generate a 1 mK-deep optical-dipole trap with a continuous-wave (CW) laser coupled to a high-finesse cavity22. At this point, it is important to study this problem from the theory side and check if it is possible to eliminate the AC Stark effect caused by the trapping laser field. The conventional magic-wavelength approach23 is not applicable to the H2 molecule (see the next paragraph). Here, we demonstrate a new approach to finding a magic wavelength. First, we take advantage of the anisotropy of the dipole polarizability in H2 to eliminate the dominant part of the light shift by choosing an excited state with a favorable spatial orientation. Second, we calculate that the residual light shift can be completely eliminated by tuning the trap laser close to one of the rovibrational quadrupole transitions. We consider the S(0) 1–0 line in the H2 isotopologue. For this line, the magic wavelength is 2413 nm (0.23 MHz red detuned from the center of the Q(2) 1–0 line). The isotropic dipole polarizability, α, of the H2 molecule in its ground electronic state, (X^{1}Sigma _g^+), is at the level of 5.4 e2a(_0^2/)E(_h)24,25, which for power densities achievable with today laser technology (1 MW/mm2 for a 0.4 mm laser beam waist)22 gives a depth of an optical dipole trap at the level of 1 mK. However, the polarizabilities in the vibrational ground, (v=0), and first excited, (v=1), states differ by almost 10%25; hence, the enormous light shift will ultimately dominate the uncertainty budget for the determination of the energies of the rovibrational transitions (the AC Stark effect not only shifts the effective position of a resonance but also causes its inhomogeneous broadening). The conventional approach to finding a magic wavelength used in atomic spectroscopy23 is not applicable to H2 molecule. The two spectroscopic states share the same electronic state; hence, the difference in polarizabilities changes very slowly with laser wavelength for the infrared and visible regions and is close to its DC value. The difference increases in the UV range24,26; see the left panel in Fig. 1. One may expect it to cross zero after the first electronic line, i.e., in the XUV range ((lambda < 110) nm), which is, however, difficult to access with available laser technology. Difference between the dynamical polarizabilities in the excited, ({|v=1,N=2,M_{N}=pm 2rangle }), and ground, ({|v=0,N=0,M_{N}=0rangle }), states (based on the data from Ref. H224). The left panel shows the difference between the isotropic polarizabilities, while the right panel shows the difference between state-averaged polarizabilities. This plot involves only the dipole contribution to the polarizability. The secondary axis presents the light shift calculated for the trap depth of 0.12 mK, which corresponds to the trap laser intensity of 0.1 MW/mm2. For the case of the (X^{1}Sigma _g^+)-state H2 molecule, we can benefit from the anisotropy of the dipole polarizability. When the electric field is aligned with the molecular axis, the static polarizability is larger by a quarter than α, and when the field is perpendicular, it is smaller by one eighth; the corresponding polarizability components are denoted by (alpha _{parallel }) and (alpha _{perp }); see Fig. 2a. The relative contribution of the two components to the effective polarizability in a given rovibrational state is determined by the direction of the trap laser electric field vector, (vec {E}_t), and the distribution of the molecular orientation in the laboratory frame, which is described by a specific spherical harmonic. We assume (vec {E}_t) to be directed along the Z axis in the laboratory frame. For cold para-H(_2) experiments, one of the most preferable transitions to consider is the 1–0 S(0) line that links the (|v=0), (N=0rangle) and (|v=1), (N=2rangle) states; we focus the analysis on this transition. The distribution of the molecular orientation in these two states is given by (Y^{0}_{0}) and (Y^{2}_{M_{N}}) spherical harmonics; see Fig. 2b and c, respectively. For the ground state, the angle distribution is isotropic, and the corresponding average of (alpha _{parallel }) and (alpha _{perp }) simply gives (alpha). For the excited state, the angle distribution depends on the projection of the rotational angular momentum, (M_{N}); see Fig. 2c. For (M_{N}=0), a molecule is more likely to orient along the electric field, while for (M_{N}=pm 2), it is more likely to be orthogonal; hence, the corresponding average polarizability, (langle alpha rangle), is larger for (M_{N}=0) and smaller for (M_{N}=pm 2). Direct integration of the two polarizability components over the angle distribution gives a general relation where (alpha = frac{1}{3}(alpha _{parallel } + 2alpha _{perp })) and (gamma = alpha _{parallel } – alpha _{perp }) are called isotropic and anisotropic dipole polarizabilities. The Supplementary Information provides a general derivation of Eq. (1) based on the time-dependent perturbation theory and irreducible spherical tensor formulation; we further use this derivation for the determination of the dynamic quadrupole polarizability. The isotropic and anisotropic polarizabilities depend on the rovibrational state; hence, we label them (alpha _{v,N}) and (gamma _{v,N}). According to Eq. (1), the average value also depends on the (M_{N}) number; hence, we label it (langle alpha rangle _{v,N,M_{N}}). The isotropic components in the ground and excited states differ by (9.3%), i.e., (alpha _{0,0}=5.4179) e(^2)a(_0^2/)E(_h) and (alpha _{1,2}=5.9193) e(^2)a(_0^2/)E(_h) (the numbers in this paragraph are the DC-limit values). It follows from Eq. (1), however, that the difference is reduced to below 0.4% when considering the (M_{N}=pm 2) angle distribution of the excited state, i.e., (langle alpha rangle _{0,0,0}=alpha _{0,0}=5.4179) e(^2)a(_0^2/)E(_h) and (langle alpha rangle _{1,2,pm 2}=alpha _{1,2}-frac{4}{21}gamma _{1,2}=5.4390) e(^2)a(_0^2/)E(_h). In Fig. 1, the right panel, shows the polarizability difference for this transition as a function of laser frequency. The upper left panel in Fig. 3, shows the corresponding Stark shifts, (Delta E^mathrm{{dip}}_{v,N,M_{N}} = -(bar{E}^{2}/2)langle alpha rangle _{v,N,M_{N}}), of the ground state and the three components of the excited state. Orientation of the H(_{2}) molecule with respect to the trapping field (vec {E}_{t}) and the definition of the parallel ((alpha _{parallel })) and perpendicular ((alpha _{perp })) components of the dipole polarizability (a). Panels (b, c) show the angle distribution of the H2 molecule in the ground and excited states, respectively (the squared modulus of (Y^{0}_{0}) and (Y^{2}_{M_{N}}) spherical harmonics), over which the two components of the polarizability are averaged to obtain (langle alpha rangle _{v,N,M_N}). To drive the transitions from the ground (M_{N}=0) to excited (M_{N}=pm 2) states, one should properly choose the polarization of the probe laser. The 1–0 S(0) transition is a quadrupole transition (the electric dipole transitions are not allowed in H2); hence, the light-molecule interaction does not probe the local electric field vector but the gradients of its components. Therefore, the selection rule does not involve only the relative orientation of the polarizations of the trap and probe lasers but also the direction of the probe laser propagation. The spherical components of the electric field gradient tensor corresponding to the (Delta M_{N}=pm 2) transitions are (see the Supplementary Information for details) where (vec {{ E}}_{p}) is the probe laser electric field vector. Assuming that the wavelength is much shorter than the beam diameter, we can neglect the gradient components perpendicular to the direction of the probe laser propagation; hence, the ((partial _{X}E_{p,X}-partial _{Y}E_{p,Y})) term can be neglected. For the assumed (vec {E}_t) directed along the Z-axis, a simple example of the configuration able to drive the (Delta M_{N}=pm 2) transitions is (vec {E}_p) directed along the X-axis and propagating along the Y-axis. At this point, the selection rule does not depend on the direction of the trap laser propagation. It matters when considering the quadrupole contribution to the polarization; see the next paragraph. For that case, we assume the trap laser to propagate along the Y-axis (the same as for the probe laser). Stark shifts (the DC-limit values) of the (|v,N,M_{N}rangle) levels in H2: (|0,0,0rangle), and (|1,2,M_{N}rangle) (top left panel), and (|0,2,M_{N}rangle) and (|1,2,pm 2rangle) (top right panel). The probe laser drives the (Delta M_{N}=pm 2) components of the 1–0 S(0) transition (red arrows in the bottom panel), while the trapping laser couples the (|1, 2,pm 2rangle) states with the (|0,2,pm 1rangle) states, the two components of the 1–0 Q(2) line (blue arrows in the bottom panel). (Left panel) Difference between the average dynamical polarizabilities in the excited and ground states in H2. This figure shows the same quantity as the right panel Fig. 1, but also includes the quadrupole contribution and is zoomed around a close neighborhood of the 1–0 Q(2) line. In the simplest approach, the quadrupole contribution was calculated using perturbation theory (Eq. (3)), see the black solid line. Full calculations show that in a close neighborhood of a resonance, the quadrupole contribution to the polarizability depends on the intensity of a trap laser; for 1 MW/mm(^{2}) the actual difference between the polarizabilities considerably deviates from the perturbation approach (see the blue dashed line), while for 0.1 MW/mm(^{2}) the deviation is almost negligible (see the solid blue line). (Right panel) Shape of the 1–0 S(0) transition in H2 determined by solving a full master equation for a three-level system with two laser fields (see Supplementary Information) for different values of the detuning of the trapping laser, (Delta _{t}), and for (I_{t}=1) MW/mm(^{2}). The difference in dynamic polarizabilities, shown in the right panel in Fig. 1, involves only the dipole contribution. Once the dominant part of the difference in dipole polarizability is eliminated by a proper choice of the ground and excited rovibrational states (see the red dashed and black solid lines in the upper left panel in Fig. 3), the quadrupole contribution is not negligible when the laser is tuned close to one of the rovibrational transitions. The dynamic quadrupole polarizability can be calculated as a sum over contributions from all rovibrational lines and electronic resonances. The electronic contribution to the quadrupole polarizability is negligible27. The quadrupole contribution to the polarizability is nonnegligible only when the trap laser is parked close to one of the rovibrational lines; in this regime, the contributions of all the other lines are completely negligible, and the full sum over the rovibrational transitions simplifies to where (k=2pi nu /c) is the magnitude of the wavevector of the trapping laser, h is the Planck constant, (nu _{v’N’leftarrow vN}) denotes the frequency of the (v’N’leftarrow vN) rovibrational transition, (Q(r_mathrm{{HH}})) is the quadrupole transition moment function, which depends on the internuclear distance, (r_mathrm{{HH}}), and (begin{pmatrix} j_{1} &{} j_{2} &{} j \ m_{1} &{} m_{2} &{} m end{pmatrix}) is the Wigner 3-j symbol. In the Supplementary Information, we give a full derivation and a detailed discussion of Eq. (3). The left panel in Fig. 4 shows a close neighborhood of the Q(2) 1–0 line (at 2413 nm) that includes not only the dipole contribution to the polarizability difference, shown in the right panel in Fig. 1, but also the quadrupole contribution [given by Eq. (3)] due to the proximity of the Q(2) 1-0 line. Effectively, the difference in polarizabilities between the ground and excited states crosses zero at the point marked by the vertical gray line in the left panel in Fig. 4. At this wavelength, the total light shift vanishes, and following Refs.23,28, we refer to it as a magic wavelength. A major difference from a typical magic-wavelength approach is that in our case, the trap laser must be spectrally very narrow, and its absolute frequency must be well controlled, i.e., the value and dispersion of the trap laser frequency should be much smaller than 100 kHz. This is achievable with current optical frequency comb and ultrastable laser technologies. The magic wavelength can be achieved by tuning the frequency of the trapping laser close to any of the rovibrational transitions involving either the ({|v=0,N=0,M_{N}=0rangle }) or ({|v=1,N=2,M_{N}=pm 2rangle }) levels. Taking into account the selection rules associated with the 3-j symbols in Eq. (3) ((|N-2|le N’le N+2), (N’=0nleftrightarrow N=0), and (M_{N}’ = M_{N}pm 1)) and the fact that there are 15 vibrational levels in H(_{2}), we can identify 44 magic wavelengths for the 1–0 S(0) line. Table 1 lists the magic wavelengths that are the most beneficial from the perspective of experimental realization, i.e., the wavelengths are accessible with today laser technology and the magic wavelength detunings, (delta _m), and Rabi frequencies, (Omega), are the largest. Note that for transitions involving (N’=4) levels there are two (M_{N}’) components contributing to the sum in Eq. (3). In a typical atomic dipole trap, the trap laser is far detuned from the nearest transition to avoid scattering losses29. Here this condition is followed, but the frequency regime is different. Instead of a strong and wide electronic line, we have an ultranarrow quadrupole rovibrational line; the few hundred kilohertz detuning is many orders of magnitude larger than the line width. In this work, we consider very strong laser fields closely tuned to rovibrational resonance; hence, we should check if the perturbation approach [Eq. (3) and the black curve in the left panel in Fig. 4] is applicable. We do so by solving a full master equation for a three-level system interacting with two laser fields; see the Supplementary Information. In the extreme case (opposite to the perturbation approach regime), a strong trap laser is tuned to the resonance center, and the probe laser measures an Autler–Townes doublet; see the black curve in the right panel in Fig. 4. As the trap laser is getting detuned, one of the components becomes weaker, and effectively, for larger detunings, the doublet turns into a single line shifted from the unperturbed position, which reproduces the ordinary light shift described by perturbation theory [Eq. (3)]. The right panel in Fig. 4 shows the exact results of the polarizability difference calculated from the position of a dominant component of the Autler-Townes doublet (see Supplementary Information for details). The blue solid and dashed lines are for trap laser intensities of 0.1 and 1 MW/mm(^{2}), respectively. These curves show that the resonant quadrupole contribution to the polarizability difference does not diverge to (pm infty) at the line center as predicted by the perturbation approach, and hence, the corresponding light shift cannot be arbitrarily large. Furthermore, the intensity of the trap laser is limited by a demand that the polarizability should not depend on laser intensity (otherwise, only a fraction of the trapped molecules will be tuned to a magic wavelength). The left panel in Fig. 4 shows that this condition is fulfilled for trap laser intensities of 0.1 MW/mm(^{2}) but not for 1 MW/mm(^{2}). This limits the maximum depth of an optical dipole trap for which the magic wavelength can be applied; the trap depth corresponding to the intensity of 0.1 MW/mm(^{2}) is 0.12 mK. At first glance, one could suspect that the most appropriate choice of a magic wavelength from the perspective of experimental realization would be either the 2–1 S(2) or 2–1 Q(2) line, since for these two cases the detuning of the trap laser is the largest and the strength of the trap laser-molecule coupling (expressed by the Rabi frequency (Omega)) is the largest, as shown in Table 1. In this analysis, we should, however, take into account one more factor. The position of the trap laser resonance (an example of which is shown in Fig. 4) is also shifted by the strong trap laser field, i.e., the denominator in Eq. (3) also depends on the (M_N) and (M’_N) numbers. We should ensure that the light shift of the trap laser resonance is much smaller than the magic wavelength detuning, (delta _{m}). The last column in Table 1 shows the light shifts for each trap laser resonance for trap laser intensity corresponding to the trap depth of 10 (mu)K. The table shows that the optimal choice of a magic wavelength is 2413 nm (− 0.23 MHz from the 1–0 Q(2) transition). For the trap depth of 10 μK, the light shift of the 1–0 Q(2) line (the (M_N) components marked with blue arrows in Fig. 3) is 8 kHz, which is over an order of magnitude smaller than the magic wavelength detuning (delta _{m}=-0.23) MHz. We demonstrate a new approach to reducing the AC Stark shift for rovibrational lines in hydrogen molecule. We analyze the para-H(_2) case; we identify a magic wavelength for the 1–0 S(0) at 2413 nm (−0.23 MHz from the 1–0 Q(2) transition). Important future directions include analysis of ortho-H(_2) and other molecular hydrogen isotopologues that have nonzero nuclear spin and the corresponding hyperfine structure. The hyperfine structure will make the analysis more complex, but the much richer structure of states opens a perspective for identifying a combination of levels that is more beneficial from the perspective of experimental implementation of the magic wavelength. The datasets generated and analysed during the current study are available from the corresponding author on reasonable request. Beyer, A. et al. The Rydberg constant and proton size from atomic hydrogen. Science358, 79–85. https://doi.org/10.1126/science.aah6677 (2017). ADSMathSciNetCASArticlePubMedMATH Google Scholar Zheng, X. et al. Measurement of the frequency of the ({2^{3}{S}-2^{3}{P}}) transition of (^{4}rm He). Phys. Rev. Lett.119, 263002. https://doi.org/10.1103/PhysRevLett.119.263002 (2017). ADSCASArticlePubMed Google Scholar Thomas, K. F. et al. Direct measurement of the forbidden (2{^{3}S}_{1}rightarrow 3{^{3}S}_{1}) atomic transition in helium. Phys. Rev. Lett.125, 013002. https://doi.org/10.1103/PhysRevLett.125.013002 (2020). ADSCASArticlePubMed Google Scholar Alighanbari, S., Giri, G. S., Constantin, F. L., Korobov, V. I. & Schiller, S. Precise test of quantum electrodynamics and determination of fundamental constants with HD(^{+}) ions. Nature581, 152–158. https://doi.org/10.1038/s41586-020-2261-5 (2020). ADSCASArticlePubMed Google Scholar Patra, S. et al. Proton-electron mass ratio from laser spectroscopy of HD(^{+}) at the part-per-trillion level. Science369, 1238–1241. https://doi.org/10.1126/science.aba0453 (2020). ADSCASArticlePubMed Google Scholar Pohl, R. et al. The size of the proton. Nature466, 213–216. https://doi.org/10.1038/nature09250 (2010). ADSCASArticlePubMed Google Scholar Hori, M. et al. Buffer-gas cooling of antiprotonic helium to 1.5 to 1.7 K, and antiproton-to-electron mass ratio. Science354, 610–614. https://doi.org/10.1126/science.aaf6702 (2016). ADSCASArticlePubMed Google Scholar Krauth, J. J. et al. Measuring the (alpha)-particle charge radius with muonic helium-4 ions. Nature589, 527–531. https://doi.org/10.1038/s41586-021-03183-1 (2021). ADSCASArticlePubMedPubMed Central Google Scholar Salumbides, E. J., Schellekens, A. N., Gato-Rivera, B. & Ubachs, W. Constraints on extra dimensions from precision molecular spectroscopy. New. J. Phys.17, 033015. https://doi.org/10.1088/1367-2630/17/3/033015 (2015). ADSCASArticle Google Scholar Ubachs, W., Koelemeij, J., Eikema, K. & Salumbides, E. Physics beyond the standard model from hydrogen spectroscopy. J. Mol. Spectrosc.320, 1–12. https://doi.org/10.1016/j.jms.2015.12.003 (2016). ADSCASArticle Google Scholar Safronova, M. S. et al. Search for new physics with atoms and molecules. Rev. Mod. Phys.90, 025008. https://doi.org/10.1103/RevModPhys.90.025008 (2018). ADSMathSciNetCASArticle Google Scholar Wolniewicz, L., Simbotin, I. & Dalgarno, A. Quadrupole transition probabilities for the excited rovibrational states of H(_{2}). Astrophys. J. Suppl. Ser.115, 293–313. https://doi.org/10.1086/313091 (1998). ADSCASArticle Google Scholar Fast, A. & Meek, S. A. Sub-ppb measurement of a fundamental band rovibrational transition in HD. Phys. Rev. Lett.125, 023001. https://doi.org/10.1103/PhysRevLett.125.023001 (2020). ADSCASArticlePubMed Google Scholar Fast, A. & Meek, S. A. Precise measurement of the D(_{2}) S(_{1})(0) vibrational transition frequency. Mol. Phys.1, e1999520. https://doi.org/10.1080/00268976.2021.1999520 (2021). CASArticle Google Scholar Cozijn, F. M. J., Dupré, P., Salumbides, E. J., Eikema, K. S. E. & Ubachs, W. Sub-Doppler frequency metrology in HD for tests of fundamental physics. Phys. Rev. Lett.120, 153002. https://doi.org/10.1103/PhysRevLett.120.153002 (2018). ADSCASArticlePubMed Google Scholar Tao, L.-G. et al. Toward a determination of the proton-electron mass ratio from the lamb-dip measurement of HD. Phys. Rev. Lett.120, 153001. https://doi.org/10.1103/PhysRevLett.120.153001 (2018). ADSCASArticlePubMed Google Scholar Wcisło, P. et al. Accurate deuterium spectroscopy for fundamental studies. J. Quant. Spectrosc. Radiat. Transf.213, 41–51. https://doi.org/10.1016/j.jqsrt.2018.04.011 (2018). ADSCASArticle Google Scholar Zaborowski, M. et al. Ultrahigh finesse cavity-enhanced spectroscopy for accurate tests of quantum electrodynamics for molecules. Opt. Lett.45, 1603–1606. https://doi.org/10.1364/OL.389268 (2020). ADSArticlePubMed Google Scholar Fasci, E. et al. Precision spectroscopy of HD at (1.38 mu rm{m}). Phys. Rev. A98, 022516. https://doi.org/10.1103/PhysRevA.98.022516 (2018). ADSCASArticle Google Scholar Castrillo, A., Fasci, E. & Gianfrani, L. Doppler-limited precision spectroscopy of HD at 1.4 (murm{m}): An improved determination of the R(1) center frequency. Phys. Rev. A103, 022828. https://doi.org/10.1103/PhysRevA.103.022828 (2021). ADSCASArticle Google Scholar Ramirez-Serrano, J., Strecker, K. E. & Chandler, D. W. Modification of the velocity distribution of H(_{2}) molecules in a supersonic beam by intense pulsed optical gradients. Phys. Chem. Chem. Phys.8, 2985. https://doi.org/10.1039/b603177c (2006). CASArticlePubMed Google Scholar Turnbaugh, C. et al. High-power near-concentric Fabry–Perot cavity for phase contrast electron microscopy. Rev. Sci. Instrum.92, 053005. https://doi.org/10.1063/5.0045496 (2021). ADSCASArticlePubMedPubMed Central Google Scholar Katori, H., Takamoto, M., Pal’chikov, V. G. & Ovsiannikov, V. D. Ultrastable optical clock with neutral atoms in an engineered light shift trap. Phys. Rev. Lett.91, 173005. https://doi.org/10.1103/PhysRevLett.91.173005 (2003). ADSCASArticlePubMed Google Scholar Raj, A., Hamaguchi, H. & Witek, H. A. Polarizability tensor invariants of H(_{2}), HD, and D(_{2}). J. Chem. Phys.148, 104308. https://doi.org/10.1063/1.5011433 (2018). ADSCASArticlePubMed Google Scholar Kołos, W. & Wolniewicz, L. Polarizability of the hydrogen molecule. J. Chem. Phys.46, 1426–1432. https://doi.org/10.1063/1.1840870 (1967). ADSArticle Google Scholar Ford, A. L. & Browne, J. C. Direct-resolvent-operator computations on the hydrogen-molecule dynamic polarizability, Rayleigh, and Raman scattering. Phys. Rev. A7, 418–426. https://doi.org/10.1103/physreva.7.418 (1973). ADSArticle Google Scholar Miliordos, E. & Hunt, K. L. C. Dependence of the multipole moments, static polarizabilities, and static hyperpolarizabilities of the hydrogen molecule on the H-H separation in the ground singlet state. J. Chem. Phys.149, 234103. https://doi.org/10.1063/1.5066308 (2018). ADSCASArticlePubMed Google Scholar Kotochigova, S. & Tiesinga, E. Controlling polar molecules in optical lattices. Phys. Rev. A73, 041405. https://doi.org/10.1103/PhysRevA.73.041405 (2006). ADSCASArticle Google Scholar Grimm, R., Weidemüller, M. & Ovchinnikov, Y. B. Optical dipole traps for neutral atoms. Adv. At. Mol. Opt. Phys.1, 95–170. https://doi.org/10.1016/s1049-250x(08)60186-x (2000). ADSArticle Google Scholar Download references The research is financed from the budgetary funds on science projected for 2019–2023 as a research project under the “Diamentowy Grant” program. P.W. is supported by the National Science Centre in Poland, Project No. 2019/35/B/ST2/01118. The research is a part of the program of the National Laboratory FAMO in Toruń, Poland. Institute of Physics, Faculty of Physics, Astronomy and Informatics, Nicolaus Copernicus University in Toruń, Grudziądzka 5, 87-100, Toruń, Poland H. Jóźwiak & P. Wcisło You can also search for this author in PubMedGoogle Scholar You can also search for this author in PubMedGoogle Scholar H.J. and P.W. both contributed to the idea conception, theory development and preparation of the manuscript. H.J. implemented the codes for finding magic wavelength and solving the master equation for the three-level system. Correspondence to H. Jóźwiak or P. Wcisło. The authors declare no competing interests. Springer Nature remains neutral with regard to jurisdictional claims in published maps and institutional affiliations. Open Access This article is licensed under a Creative Commons Attribution 4.0 International License, which permits use, sharing, adaptation, distribution and reproduction in any medium or format, as long as you give appropriate credit to the original author(s) and the source, provide a link to the Creative Commons licence, and indicate if changes were made. The images or other third party material in this article are included in the article’s Creative Commons licence, unless indicated otherwise in a credit line to the material. If material is not included in the article’s Creative Commons licence and your intended use is not permitted by statutory regulation or exceeds the permitted use, you will need to obtain permission directly from the copyright holder. To view a copy of this licence, visit http://creativecommons.org/licenses/by/4.0/. Reprints and Permissions Jóźwiak, H., Wcisło, P. Magic wavelength for a rovibrational transition in molecular hydrogen. Sci Rep12, 14529 (2022). https://doi.org/10.1038/s41598-022-18159-y Download citation Received: Accepted: Published: DOI: https://doi.org/10.1038/s41598-022-18159-y Anyone you share the following link with will be able to read this content: Sorry, a shareable link is not currently available for this article.
Elton John’s TAMMY FAYE Musical Sets Premiere Dates VIDEO: Meet Two Stars of DEAR EVAN HANSEN- Stephen Christopher Anthony & Sam Tutty MY SON’S A QUEER (BUT WHAT CAN YOU DO?) Will Transfer to the West End Full Cast Announced For the Royal Shakespeare Company’s MY NEIGHBOUR TOTORO BroadwayWorld TV
The world premiere of a chamber piece by Syracuse University Professor Natalie Draper is among the highlights of the Society for New Music (SNM)’s 2022-23 season. The premiere is one of six programs that SNM is presenting this academic year throughout Central New York, encompassing a range of sounds, styles and compositional scenes. Founded in 1971, SNM is the only year-round new music organization in New York state outside of Manhattan. The Syracuse-based nonprofit also is a longtime University partner, with students, faculty and alumni annually participating in 30-some concerts and workshops. For more information and to purchase tickets, visit societyfornewmusic.org. The schedule is as follows: Friday, Sept. 9 Second performance of “Home Burial“ opera by Charles Lupia ’77, L’91 CNY Jazz Central (441 East Washington St., Syracuse) 7:30 p.m. Lupia makes his stage debut with “Home Burial,” a one-act chamber opera based on Robert Frost’s “The Death of the Hired Man.” Against the backdrop of a familial homecoming, Lupia considers themes of power, friendship, guilt and redemption. The production stars soprano Laura Enslin, tenor Dan Fields ’17 and bass-baritone David Neal, accompanied by pianist Sar Strong G’98, violinist Jonathan Hwang and cellist Zachary Sweet—all under the direction of Heather Buchman. The first half of the all-American program features vocal selections by Leonard Bernstein, Stephen Paulus and Judith Cloud. Sunday, Oct. 2 “Evolutions: Music by the Next Generation” St. Paul’s Episcopal (220 East Fayette St., Syracuse) 4 p.m. Natalie Draper “Evolutions is a three-movement work exploring gradual change, the idea that something can evolve out of nothing,” explains Natalie Draper, an assistant professor in the Setnor School of Music in Syracuse’s College of Visual and Performing Arts. Scored for an extended Pierrot Ensemble (i.e., flute, clarinets, violin, viola, cello, piano and percussion), the program’s title work begins with a groove, which Draper reworks through various instrumental colors and registers. The wave-like second movement swells before receding into a lush, choralesque finale. Sean O’Loughlin Also on the program are “Floating Points“ by Ryan Carter and “Pointillism” by Symphoria Principal Pops Conductor Sean O’Loughlin ’95, both commissioned by SNM. “Minnaloushe” by Alexandros Darna completes the program. Darna is the 2022 winner of the Brian M. Israel Prize, co-sponsored by SNM and the New York Federation of Music Clubs. The concert is performed by members of the Society Players. Friday, Nov. 4 Music from the Society of Composers Inc., Region II Conference Park Central Presbyterian Church (504 East Fayette St., Syracuse) 7:30 p.m. SNM teams up with the Setnor School, host of the Society of Composers Inc. (SCI)’s Region II Conference, for an evening of new music by established and rising stars. The program features works by SCI members Jiyoun Chung, Wenbin Lyu, Paul Novak, Charles Peck, Paul Richards, Sami Seif and Octavio Vazquez. Friday, Feb. 17-Sunday, Feb. 19 Annual “Vision of Sound” performance Syracuse, Geneva and Rochester (venues TBA) Times TBA Christopher Cresswell An SNM tradition for 17 years, “Vision of Sound” presents an evening of original music, dance and movement by regional artists. The Society Players perform works by Christopher Cresswell ’11, former Syracuse professor Sally Lamb McCune, Ryan Chase, Carrie Magin, Mark Olivieri and Doc Woods. Sunday, March 26 Syracuse Symposium concert “Repair Works” Hergenhan Auditorium (Newhouse 3), Syracuse University 2 p.m. SNM marks Syracuse Symposium’s yearlong theme of “Repair: Retelling, Resisting, Reimaging” with the world premiere of a piece by former Syracuse professor James Gordon Williams. Rounding out the program are “Glorious Mahalia” by Stacy Garrop; “Oh, Freedom” by guest composer Anthony R. Green; and “I told you” by Flannery Cunningham. Sunday, April 23 Music by SNM prize-winners St. Paul’s Episcopal (220 East Fayette St., Syracuse) 4 p.m. SNM concludes its 51st season with new music by prize-winning composers. Featured are SNM-commissioned composer Steve Ferre’s “Shadows of Innocence,” winner of the Robert Avalon International Competition for Composers; Octavio Vazquez’s “Migrant,” co-commissioned by SNM and the National Endowment for the Arts; and 2022 Israel/Pellman prize-winner Christian-Frédéric Bloquert’s “Serenade: Recomposed.” SNM is the brainchild of Neva Pilgrim, who co-founded the successful nonprofit in 1971. Not even a global pandemic has deterred SNM from continuing to fund commissions, present concerts and workshops, and recognize emerging composers. “We’re excited about the next 50 years,” says Pilgrim, who has served as an artist-in-residence at Syracuse and Colgate universities. “The success of the Society for New Music is a testament to not only the hard work of many people, but also the growing popularity of contemporary classical music.” Pilgrim, who also has produced and hosted “Fresh Ink” on WCNY-FM for the past 26 years, sums up the SNM aesthetic with three words: “Variety. Imagination. Originality.” Regular tickets are $20. Student and senior citizen tickets are $15. Audience members 18 and under are free of charge. “Repair Works” is free to Syracuse students, faculty and staff with ID. Light Work presents “Caribbean Dreams” by Brooklyn-based photographer Samantha Box. Opening Thursday, Sept. 1, in Light Work’s Kathleen O. Ellis Gallery, this solo exhibition is a series of complex studio still lifes of personal, familial and regionally referenced objects, heirlooms, fruits,… In its commitment to better serve all of the Central New York community, Syracuse Stage has announced the addition of two sensory friendly performances to the 2022-23 season: “How to Dance in Ohio” on Saturday, Oct. 8 at 7:30 p.m…. Producers Ben Holtzman ’13 (he/him), Sammy Lopez ’13 (he/him), Fiona Howe Rudin (she/her) and Syracuse Stage announce that tickets are now on sale for the world premiere musical “How to Dance in Ohio.” With rehearsals scheduled to begin in Syracuse… A strong film education from the College of Visual and Performing Arts, robust resume of production experience and lifelong obsession with the New York Yankees prepared Gabe Honig ’01 for a “dream come true” opportunity to produce “The Captain,” a… From its botanical properties to its existence as a global trading commodity, its role in international relations and the culture surrounding its consumption, tea has brought people together from around the world for various reasons for centuries. An academic gathering… If you need help with your subscription, contact [email protected].
Oat_Phawat Canada-based New Gold Inc. (NYSE:NGD) released its second-quarter 2022 results on August 4, 2022. Note: This article is an update of my article published on July 13, 2022. I have followed NGD on Seeking Alpha since January 2019.
NGD Map Presentation (New Gold)
NGD Map Presentation (New Gold) Revenues for the second quarter of 2022 decreased significantly from $198.2 million to $115.7 million due to lower gold and copper sales, partially offset by higher realized gold prices. Lower sales in the quarter were impacted by the timing of concentrate shipments at New Afton of approximately 7,500 gold eq. Ounces which have been deferred to the third quarter. The company posted a net loss of $37.9 million compared to a loss of $15.8 million in 2Q21. Adjusted net loss was $16.7 million from an income of $26.7 million in 2Q21. Gold equivalent production for the quarter was 70,514 ounces (52,431 ounces of gold, 7.4 million pounds of copper, and 117,318 ounces of silver). All-in sustaining costs AISC were $2,373 per GEO in 2Q22, including total cash costs of $1,296 per GEO. Heavy rainfall affected the Rainy River mine, which experienced flooding in the open pit and impacted the mine plan, and led to lower gold production for 2Q22. Also, at New Afton, underground tonnes mined per day decreased over the prior-year periods due to the planned completion of Lift mining activities and the closure of the low-grade-higher cost recovery level zone in June, earlier than planned. The production ramp-up of the B3 zone continued on schedule during the quarter, with development expected to be completed by September. It was a terrible quarter in terms of gold production, and the stock tumbled to its lowest point on a one-year basis on the news. As a result, 2022 operational and cost guidance were updated to reflect the changes in the plan and related cost impact and other factors. My investment thesis has not changed since my prior article on July 13. I believe the stock is essentially a trading opportunity but should not be considered a long-term investment. New Gold’s assets are weak and technical issues are recurring often, increasing the risk of holding the stock. However, it is clear that the company will probably announce better gold production in the third quarter since most of the technical problems have now been resolved. CEO Renaud Adams said in the conference call: Production and mine sequencing were impacted by heavy rainfall resulting in the flooding of the pit. While significant progress has been made to date to restore the situation and optimize each step moving forward, NGD has underperformed the VanEck Vectors Gold Miners ETF (GDX). NGD is now down 35% on a one-year basis.
NGD Quarterly Gold equivalent production history (Fun Trading)
NGD Quarterly Gold equivalent production history (Fun Trading) NGD produced 70,514 GEOs during the second quarter. The production of gold equivalent ounces GEO includes gold, silver, and copper. Also, adding even more salt to the wood, the company said it sold 62,367 GEOs in 2Q22. The reason was an unfortunate timing in sales. The gold price realized for 2Q22 was $1,879 per ounce.
NGD Quarterly Gold Price history (Fun Trading )
NGD Quarterly Gold Price history (Fun Trading ) AISC was $2,373 per ounce, which is terrible and should come down to a more reasonable valuation. The spike was due to the low production sold this quarter due to a timing delay at the New Afton mine and the temporary flooding experienced at the Rainy River mine.
NGD Quarterly AISC history (Fun Trading)
NGD Quarterly AISC history (Fun Trading) Below is shown the production for the past three quarters and per metal:
NGD Quarterly production per metal 4Q21 to 2Q22 (Fun Trading)
NGD Quarterly production per metal 4Q21 to 2Q22 (Fun Trading) Gold production for the Rainy River mine was 42,516 Au ounces and 9,916 Au ounces for the New Afton mine.
NGD Gold production per mine 2Q22 (Fun Trading)
NGD Gold production per mine 2Q22 (Fun Trading) The gold production was 52,431 Au ounces, a multi-year low. Furthermore, because of the ore used in Rainy River, the grade per tonne was significantly lower this quarter. Unfortunately, it was also the case for the New Afton mine.
NGD Quarterly Grade per mine history (Fun Trading)
NGD Quarterly Grade per mine history (Fun Trading) The company indicated that the operations at the Rainy River were adversely impacted by heavy rainfall and flooding. The total tonnes mined from the open pit were lower because the company utilized the low-grade ore material during the quarter producing lower gold ounces. However, The lower tonnes mined (ore and waste) year-to-date has caused a change to the mine plan for the remainder of 2022… This change requires the operation to continue to process low-grade ore material in the second half of 2022 – (earlier press release). This operating change has forced the company to revise and lower the Rainy River’s gold equivalent production for 2022. It is now expected to be between 230K to 250K GEOs from 265K to 295K GEOs. Moreover, operating expenses per GEO are forecasted to be between $960 to $1,040 per GEO, from $730 to $810 per GEO. The increase is due to the lower gold production and current inflationary cost pressures. Finally, all-in sustaining costs AISC are expected to be between $1,620 to $1,720 per GEO, from $1,270 to $1,370 per GEO.
NGD 2022 new guidance (New Gold Press release)
NGD 2022 new guidance (New Gold Press release) The company focused on B3 and C-Zone development and closed the low-grade-higher cost recovery zone earlier than planned, which is a positive. However,
As a result of the early shutdown, tonnes mined were lower than expected. To maintain mill feed, the operation utilized the low-grade stockpile during the quarter, resulting in lower grades and recoveries, and ultimately, lower production. It was very alarming news for shareholders. The issue is that the Rainy River has been deeply impacted, affecting the production for the remaining 2022 and possibly even 2023. We are talking about 19.2% of the 2022 production gone. It was not the first time the Rainy River mine inflicted pain on New Gold’s shareholders. On August 11, 2021, New Gold Inc. released its second quarter of 2021 results. The company had a piece of bad news about the Rainy River, as well, and NGD dropped to a 52-week low. The market sold off on the news, but the stock recovered later. However, the market may be less accommodative, especially with a weakening gold price due to the FED’s hawkish action against rampant inflation. Thus, I do not recommend a long-term investment in NGD for apparent reasons. However, after this giant slide, I believe the stock is now attractive, and I suggest buying NGD and trading the stock, which will probably recover a little from this low price. Note: NGD trades in the NYSE American and can trade below $1 without the threat of delisting. However, in rare cases, the NYSE American exchange can force a company to reverse split to avoid delisting. 47.6 49.5 212.9 46.5 13.2 30.3 -1.1 47.6 -10.4 -38.7 Data Sources:Company release Note: More historical data are available for subscribers only.
NGD Quarterly Revenues history (Fun Trading)
New Gold posted revenue of $115.70 million for 2Q22, down 41.6% from the same quarter a year ago and down 33.8% sequentially. The company posted a net loss of $37.9 million compared to a loss of $15.8 million in 2Q21. Adjusted net loss was $16.7 million from an income of $26.7 million in 2Q21.
NGD Quarterly Revenues history (Fun Trading) New Gold posted revenue of $115.70 million for 2Q22, down 41.6% from the same quarter a year ago and down 33.8% sequentially. The company posted a net loss of $37.9 million compared to a loss of $15.8 million in 2Q21. Adjusted net loss was $16.7 million from an income of $26.7 million in 2Q21.
NGD Quarterly Free cash flow history (Fun Trading)
Note: The generic free cash flow is the cash from operating activities minus CapEx.
NGD Quarterly Free cash flow history (Fun Trading) Note: The generic free cash flow is the cash from operating activities minus CapEx. The free cash flow for 2Q22 was a loss of $38.7 million, with a trailing 12-month free cash flow loss of $2.6 million.
NGD Quarterly Cash versus Debt history (Fun Trading)
NGD Quarterly Cash versus Debt history (Fun Trading) New Gold’s net debt was $69.5 million this quarter. As of June 30, 2022, the debt was $394.4 million, and the total cash was $324.9 million. The total liquidity position was $807 million at the end of March 2022. On May 16, 2022, New Gold announced redemption of the outstanding $100 million aggregate principal amount of its 6.375% Senior Notes due 2025. NGD paid with cash. Note: New Gold’s total investment in 2Q22 was worth $47.7 million compared to $59.5 million in 4Q21. The most significant investment is in Artemis Gold and the Blackwater project. This amount is included in the total cash above.
NGD other investments (NGD PR)
NGD other investments (NGD PR)
NGD TA Chart (Fun Trading)
NGD TA Chart (Fun Trading) NGD forms a descending channel pattern with resistance at US$0.80 and support at US$0.68. NGD dropped significantly on July 12 when it reported production problems at the Rainy River. The overall strategy that I promote in my marketplace, “The Gold And Oil Corner,” is to keep a core long-term position and use about 55%-65% to trade LIFO (see note below) while waiting for a higher price target for your core position between US$1.40 and US$1.45. I suggest selling about 50% of your position between US$0.80 and US$0.92 and accumulating between $0.69 and $0.67. Furthermore, NGD is excellent trading stock and is particularly liquid, making it easier to trade. The gold price is again struggling to stay above US$1,740 per ounce due to the Fed’s action against the rampant inflation that threatens the world economy. The market expects the Fed to hike the interest rate by 50-point and potentially 75-point for the third time. In this case, the gold price will struggle to stay above $1,700, and NGD could drop to lower support around US$0.63-US$0.65. Watch gold and silver prices like a hawk. Note: The LIFO method is prohibited under International Financial Reporting Standards (IFRS), though it is permitted in the United States by Generally Accepted Accounting Principles (GAAP). Therefore, only US traders can apply this method. Those who cannot trade LIFO can use an alternative by setting two different accounts for the same stock, one for the long term and one for short-term trading. Warning: The TA chart must be updated frequently to be relevant. It is what I am doing in my stock tracker. The chart above has a possible validity of about a week. Remember, the TA chart is a tool only to help you adopt the right strategy. It is not a way to foresee the future. No one and nothing can. Author’s note:If you find value in this article and would like to encourage such continued efforts, please click the “Like” button below as a vote of support. Thanks.
Join my “Gold and Oil Corner” today, and discuss ideas and strategies freely in my private chat room. Click here to subscribe now. You will have access to 57+ stocks at your fingertips with my exclusive Fun Trading’s stock tracker. Do not be alone and enjoy an honest exchange with a veteran trader with more than thirty years of experience. “It’s not only moving that creates new starting points. Sometimes all it takes is a subtle shift in perspective,” Kristin Armstrong. Fun Trading has been writing since 2014, and you will have total access to his 1,988 articles and counting.
This article was written by I am a former test & measurement doctor engineer (geodetic metrology). I was interested in quantum metrology for a while. I live mostly in Sweden with my loving wife. I have also managed an old and broad private family Portfolio successfully — now officially retired but still active — and trade personally a medium-size portfolio for over 40 years. “Logic will get you from A to B. Imagination will take you everywhere.” Einstein. Note: I am not a financial advisor. All articles are my honest opinion. It is your responsibility to conduct your own due diligence before investing or trading. Disclosure:I/we have a beneficial long position in the shares of NGD either through stock ownership, options, or other derivatives.I wrote this article myself, and it expresses my own opinions. I am not receiving compensation for it (other than from Seeking Alpha). I have no business relationship with any company whose stock is mentioned in this article. Additional disclosure: I have a short-term position in NGD and intend to trade as explained in my article.
This is a carousel. Use Next and Previous buttons to navigate A map provided by the town of West Hartford shows the area the master plan will study. LaSalle Road is one focus of the West Hartford Center master plan, with a decision needing to be made about whether the street should be kept as a one-way road, or be returned to two-way traffic. The intersection of Farmington Avenue and Main Street will be part of the town’s reconstruction plans. WEST HARTFORD — Officials say a new master plan will serve as a guide for the future reconstruction of the center of town. The town will use approximately $400,000 in American Rescue Plan Act funds to have consultant Stantec devise what will be known as the West Hartford Center Infrastructure Master Plan project. Duane Martin, the town’s director of community development, introduced the concept behind the plan to Town Council members at the most recent Community Planning and Economic Development committee meeting. “Farmington Avenue and … LaSalle Road has been beaten up by a lot of projects, mostly utility related, going on for several years,” Martin said. “We’ve been doing piecemeal repairs here and there. The idea of doing a master plan came up focusing on the center.” Martin said the area has been the subject of “a lot of activity going on in a fairly short period of time,” referencing the changing of LaSalle Road to a one-way, the experimentation of back-in angled parking and expanded outdoor dining. He also said the area’s street trees are at the end of their lives and there’s a “hodgepodge of street furniture and amenities.” “A lot of that area has some shared infrastructure elements,” Martin said about the zone they’ll study. “So rather than just looking at LaSalle and Farmington and doing the piecemeal approach that we’ve been doing for years, we found it best to look at the area in its entirety and come up with a plan … recognizing that it is the center area. But a lot of those elements that come out of this plan could be used in other parts of town.” Martin also said the project accelerated because of recent complaints about traffic and parking in West Hartford Center, so they added a traffic analysis to the plan. “The project also blossomed because as you may have heard, there’s been some complaints about traffic in the center and parking issues and rideshares and double-parking,” Martin said. “It then expanded into a traffic and parking evaluation for potential improvements, including our surface parking lots that are within the limits of the plan as well as the two town parking garages and even the private parking garage.” Martin said that once the study is completed the town will immediately put it to use by first focusing on the reconstruction of LaSalle Road. That will be followed by the reconstruction of Farmington Avenue and the intersection at Main Street. Martin said both projects will be funded using money received from the American Rescue Plan Act. “It won’t just sit on a shelf. It will be put to immediate use, which is good for the town,” Martin said. “We’re hoping to have the design for the reconstruction of LaSalle Road done through this winter and have that go into construction next year. The following year we’ll follow with Farmington Avenue. It would be very challenging to do both of those roads in the same construction season. They’re going to be challenging as it is.” LaSalle Road, Martin said, presents its own challenges as the study will have to determine whether the road should be reverted back to being a two-way street. “It has worked well, but has caused some concerns and complaints with the adjacent neighboring streets, so we want to focus on whether or not that’s a good thing to keep or modify,” Martin said. A proposed apartment and condominium complex at the corner of LaSalle Road and Arapahoe Road could have an impact on that decision if approved. Council member Mark Zydanowicz expressed some concern about the longer-term ramifications about those decisions. “LaSalle Road one-way or two-way was one of the first priorities,” Martin said. “LaSalle Road is a very busy street as everybody knows with the conflict between cars, pedestrians, bicyclists and parking. There are some sight-line issues. We wanted to see if there is any traffic calming that could be implemented to make things safer. They are looking at it long-term.” Council member Ben Wenograd said there should also be some discussion about possibly restricting cars from the area entirely. “There’s been talk over the years to at least explore the idea of not having cars,” Wenograd said. “It’s certainly a trend in lots of places to look at as much as possible a car-free downtown and all the advantages of that, and challenges obviously. This is a mission that will expand with public outreach. I hope that it’s at least discussed.” Public outreach is the next step for the plan, Martin said, with a community information day set to be held sometime in September at the town hall. Martin said an informal meeting would follow that evening. Information about that meeting, and updated information regarding the master plan will be posted on the town’s planning divisions website.
Elections In a private call with major givers, Ronna McDaniel lauded the quality of Republican Senate candidates but said they’re getting swamped by Democrats on the airwaves. During a 36-minute conference call, Ronna McDaniel argued that the party has strong Senate candidates and a favorable political environment. | Samuel Corum/Getty Images By Alex Isenstadt
Link Copied Republican National Committee Chairwoman Ronna McDaniel rallied major donors Wednesday to get behind the GOP’s efforts to flip the Senate — a plea that comes amid rising concerns in the party over its candidates’ lagging fundraising totals and its overall prospects. During a 36-minute conference call, a recording of which was obtained by POLITICO, McDaniel argued that the party has strong Senate candidates and a favorable political environment. But she went on to say that Republican candidates are being swamped by Democrats in the chase for campaign cash. The Supreme Court’s June decision nixing Roe v. Wade, McDaniel said, triggered a gusher of online donations for the opposition. McDaniel – who was joined by former House Speaker Newt Gingrich, the architect of the party’s House takeover in the 1994 midterm election – also said Republican small donors had been “decimated” by the lagging economy. That’s made the GOP more dependent on large contributors, such as those on the call, to compete against Democrats on the air in the final weeks before the election, she said. “We absolutely have better candidates and a better message,” McDaniel said, pushing back on what she described as a false, media-driven narrative that the GOP’s prospects in Senate races are waning. “But,” she said, “we do need financial firepower to drive our effort.” “Newt and I were just talking, in this environment, our candidates can win if they’re outspent two-to-one, but if it gets four, five, six to one, it becomes more difficult, and we’re seeing that specifically on the Senate side. So my call to action today,” McDaniel added, “is to please help us invest in these Senate races specifically. Give to any of these Senate candidates, all of these Senate candidates if you can, so all of them can be on TV.” Republican officials say the RNC hosts such calls every few months to provide updates to major givers. The call comes as Senate Minority Leader Mitch McConnell and other top Republicans are mobilizing to close the financial gap. McConnell has spent August working the phones to raise money from major donors, according to a person familiar with the conversation. Some senior Republicans have privately grown bearish on the party’s hopes of winning the majority, particularly in light of its growing fundraising woes. An array of candidates in key races — from Arizona’s Blake Masters to Ohio’s J.D. Vance to Pennsylvania’s Mehmet Oz — have found themselves badly outraised by their Democratic opponents. (At one point in the call, an Arizona donor noted that Masters’ rival, Democratic Sen. Mark Kelly, is flooding the airwaves and made an appeal for other participants to help Masters.) Adding to the concern is the National Republican Senatorial Committee’s recent decision to slash more than $10 million in planned TV ad spending. The Senate GOP campaign arm trails its Democratic counterpart in cash on hand by roughly $31 million, according to the most recent filings. That move has forced the Senate Leadership Fund, a super PAC closely aligned with McConnell, to fill the void with large investments in states like Pennsylvania and Ohio. During the call, McDaniel said the RNC was creating a joint-fundraising account with 10 state parties to help fund voter turnout programs. The fundraising struggles have fueled broader worries about the strength of the party’s candidates. McConnell last week appeared to lower expectations for a Senate takeover, saying “there’s probably a greater likelihood the House flips than the Senate.” “Senate races are just different — they’re statewide, candidate quality has a lot to do with the outcome,” said McConnell, adding that after the election “we’re likely to have an extremely close Senate, either our side up slightly or their side up slightly.” During Wednesday’s call, one donor asked Gingrich to respond to McConnell’s remark, prompting the former House speaker to say he “suspects” the GOP leader “regrets having said that,” and that it wasn’t “useful.” But Gingrich also lavished praise on McConnell, saying the Senate GOP leader is working aggressively to help Republican candidates compete financially. Gingrich also noted that McConnell had been “burned” in past election years, when the party fielded candidates “who were, to put it mildly, strange.” “Mitch has always been more cautious, and I’ve always been very optimistic, so you can maybe draw the line in the middle,” said Gingrich, who said he also believes the party’s candidates are strong. During a question-and-answer session, Republican mega-donor Steve Wynn asked whether there are any dark-money nonprofits that contributors could give to. Unlike political action committees, those groups aren’t required to disclose their donors. Some donors, Wynn said, “are self-conscious for reasons that are personal to them, business people and folks like that” and would rather give anonymously. The billionaire also offered up some messaging advice. Republican candidates, he said, should run aggressive TV ads casting Democrats as advocates of tax policies that would hurt lower-wage earners and small businesses. “Hard-hitting kind of spots with a man’s voice, no soft pedal,” Wynn suggested, before giving a sample script: “‘They’re coming after you if you’re a waiter, if you’re a bartender, if you’re anybody with a cash business … they’re coming after you.’”
Digital News Writer A young woman tragically drowned during a swim that was streamed live on Facebook earlier this month. Hellen Wendy Nyabuto, who was born in Kenya and worked in Canada, died in a hotel pool in Chatsworth, a township in Ontario, on Aug. 18, NBC News reported. In the video, which has now been deleted, Nyabuto was initially seen smiling in the shallow end of the pool, according to The Toronto Star. A few minutes later, the newspaper reported that she swam to the deeper end of the pool and began struggling. According to the Star, she could be heard calling for help before the video went silent. Hours later, her body was seen at the bottom of the pool, according to CNN. "An individual was removed from the water and pronounced deceased after life-saving measures were unsuccessful," the Ontario Provincial Police said, per NBC News. The outlet reported that police say her death remains under investigation but is not considered suspicious. The Ontario Provincial Police did not immediately respond to PEOPLE's request for comment. Nyabuto had been living in Toronto for the past three years and worked part-time as a health worker while studying nursing in Collingwood, her family told CNN. According to the outlet, she was 23, although the Toronto Star reported she was 24. According to her father, she was doing fine prior to the accident. "She communicated with me two days before she perished," Nyabuto John Kiyondi told the outlet. "She sounded very fine and I was very happy." Never miss a story — sign up for PEOPLE’s free daily newsletter to stay up-to-date on the best of what PEOPLE has to offer. Her father told the outlet that he did watch the video. "I cried," he said. "It is terrible." In a message shared on a GoFundMe page, Nyabuto’s brother wrote that she had “a warm smile and a charming heart.” "Everyone who met Wendy had their spirits lifted. She was passionate about her work and she touched many hearts," wrote her brother, Enock Nyabuto. She also helped support her loved ones back home in Kenya. "Hellen was the breadwinner back home for her family," Alfonce Nyamwaya, Nyabuto's close friend, told the Toronto Star. "All the financial responsibilities (of their family in Kenya) were on her," her brother told CNN. Now, her family is trying to raise money to help cover funeral and burial arrangements. "We are soliciting your generous donation to repatriate her body to Nairobi, Kenya as per the wishes of our family," her brother wrote on the fundraising page. "According to our tradition, one is supposed to be buried where he or she was born," her father told CNN. "I'll not feel comfortable, psychologically, if my daughter is buried away from Kenya." As of Thursday, donations have now surpassed their initial goal of 50,000 Canadian dollars (around $38,000). By clicking “Accept All Cookies”, you agree to the storing of cookies on your device to enhance site navigation, analyze site usage, and assist in our marketing efforts.
If you haven’t heard of Vintage Culture yet, it’s time you put him on your radar. This DJ and producer continues soared across the scene, putting out remixes for artists like Bob Moses and Franky Wah on top of his own singles such as “Adidas & Pearls” with Solardo and LOWES, “This Feeling” with Goodboys, and “Commotion” with Maxi Jazz, to name a few. This summer has seen Vintage Culture continue his dominant rise as he’s taken the stage everywhere from Tomorrowland to DAY MVS XL. He also recently dropped an updated version of Three Drives‘ legendary track “Greece 2000,” putting a modern twist on the tune that first dropped in 1997 with his signature melodic style. Additionally, he’s set to head off to New York this weekend to take the stage at Brooklyn Mirage for an extended set that is sure to be filled with new material. If you’re in New York, we can’t recommend it enough to try and grab a ticket to this show at Brooklyn Mirage – it’s one you won’t want to miss, so grab tickets via DICE. If you can’t make it to this show, Vintage Culture is on a roll in North America; he will be playing in Las Vegas at Marquee Day Club on August 28 and at ARC Music Festivalin Chicago on September 2-4. Luckily for us, Vintage Culture took some time out of his busy schedule ahead of the show to sit down with us and chat about what’s in store for those making their way to Brooklyn, his thoughts on the scene in New York, and shares some big plans for So Track Boa Music Festival in 2023. Listen to “Greece 2000” and read on for the full conversation. Hey Lukas, thank you so much for taking the time to talk with us today. You’re playing The Brooklyn Mirage this month, how excited are you to perform there, and do you have visuals that are modified to fill the entirety of the screens? Hey, thank you for having me! New York is always a highlight of my tours. I’m preparing a set far in advance and will have some very special unreleased tracks and new material. These tracks will make their debut in New York. Brooklyn Mirage has also become one of my favorite venues to play. I feel great about this upcoming show. Danny Tenaglia, Ferreck Dawn, and Bruno Furlan have joined the line-up. This is going to be a night to remember. New York City is one of the most significant homes for dance music, and the energy there is contagious. Having played there multiple times, what do you love most about NYC that makes it stands out as special? New York is like no other city in the world. The energy and enthusiasm of the crowd hits you like a tidal wave the minute you step on stage. This is my third performance in New York. Many fans know my music now. It’s a special feeling to hear them singing along to my tracks. I also make new fans whenever I’m in NYC. I’ve seen the audience grow over the years. I’ve even noticed Brazilian flags in the audience at my shows in New York. I’ve become very comfortable in this city. I’m grateful to the fans for making me feel welcome and at home. You’ve been playing so many shows this year, and recently DAY MVS XL this month. How has traveling taken a toll on your mental health? Do you have any self-care routine to keep you grounded while touring? What advice can you give to other artists who are struggling but are afraid to speak out? I feel very positive and energized on this tour. I have had the same team with me for many years. I’m loyal to them, and they are very loyal to me. We’re our own little family. I also take the time to keep in touch with friends and family back home. It’s important not to let this business go to your head. Keep your true friends and family close and remember what’s really important in life… And never be afraid to ask for help if you need it. Let’s switch gears. You recently breathed life into Three Drives’ classic tune “Greece 2000,” which was first released 25 years ago. What prompted you to put a modern touch on the track, and how did you bring it up to speed with the current era? I always loved the original; it’s a true classic of electronic music. I started experimenting with the track during the pandemic. Many of these classics still find a place in my set list- they are part of my musical roots. I was very inspired to begin work on a version for 2022– And honored as well. It was important to keep the spirit and vibe of the original while also adding a unique interpretation. With my sound designs and production in 2022, I think my updated version is a positive balance between the original version and my own sound in dance music this year. When we last spoke in 2020, you spoke about how the scene in Brazil had grown over the past decade, but the past two years have been rough for the planet. What do you feel is the current state of the scene there? Has it been recovering? Brazil is back with all new excitement. Playing my first shows at home after the lockdown was like a reunion. I was thrilled to see the fans again, and it looked like the feeling was mutual. My festival, So Track Boa, sold out fast- 40,000 tickets. The music scene in Brazil is definitely reborn. In 2023, I’ll be personally curating the So Track Boa music festival in Brazil. Expect to see some great international artists, plus the best Brazilian dance music producers. Nurturing new talented musicians and helping them develop careers is very important. For me, it’s awesome to see the most talented Brazilian producers side by side with the best international music producers at So Track Boa. Finally, just for fun. you said you’ve once played a 24-hour set: what’s the longest you would like to go eventually? Or what is the longest you think you could go? During the pandemic, I did a DJ set for the fans via YouTube, which went on all weekend. We started rolling on Friday night and finished on Sunday. Being on stage is the happiest place in the world for me. The stage is where I’m most comfortable. This is where I’m totally myself. I’m really thrilled to be sharing my new music and hits from over the years with my New York fans. To celebrate, I’ll be performing a special extended set. See You Soon, New York! Website | Facebook | Twitter | Instagram | SoundCloud | YouTube


 STAGE MAG
 NEXT BWW EVENTS STREAM




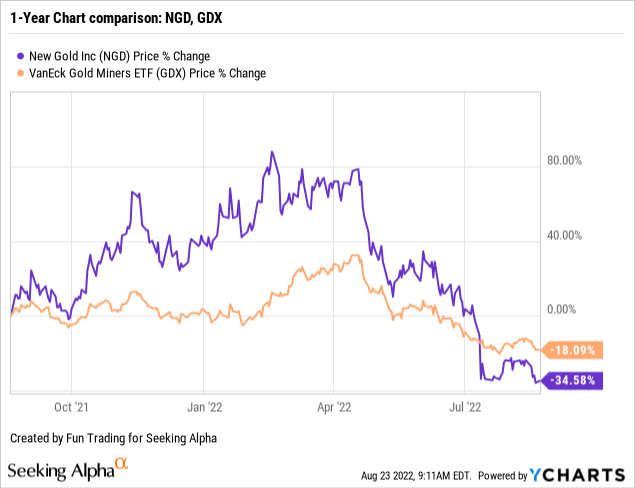


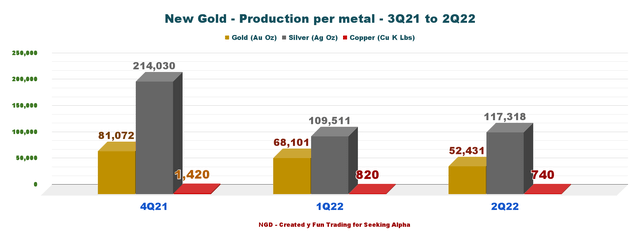
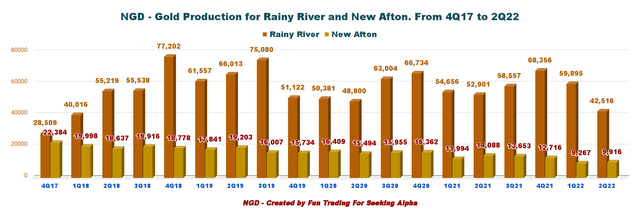
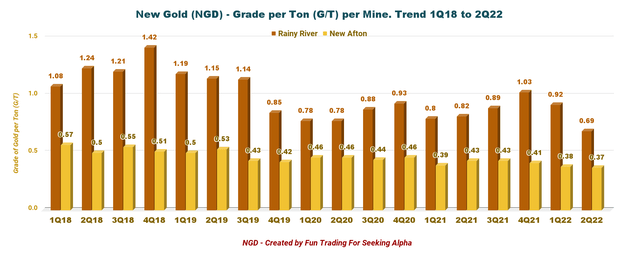
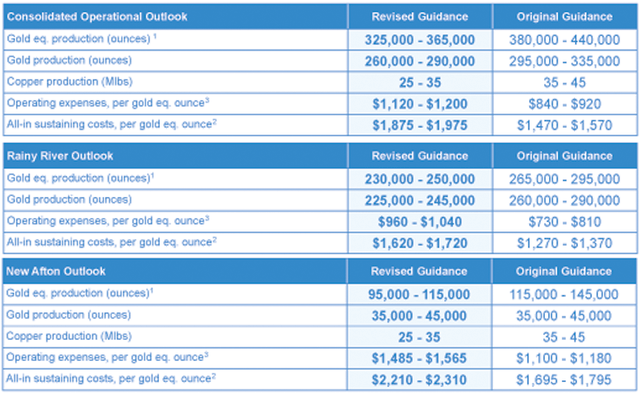


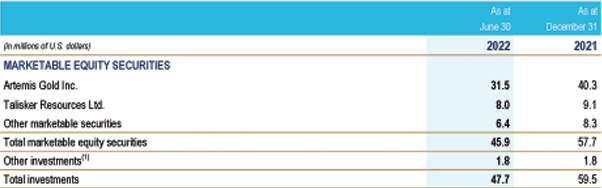




 Ad Choices
